Page 17 - ClearGov | Documents
P. 17

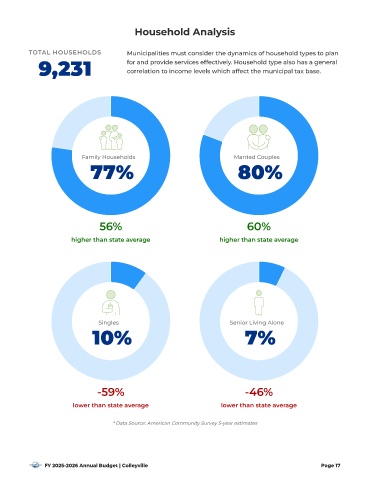
Ho useh old  Analysis


           T O T A L    H  O  U  S  E  H  O  L  D  S
                                           Municipalities must consider the dynamics of household types to plan
              9,231                        for and provide ser vices effectively. Household type also has a general
                                           correlation to income levels which affect the municipal tax base.


                            Family Households                                 Married Couples
                               77%                                              80%


                                  56%                                              60%

                         higher than state average                        higher than state average


                                  Singles                                    Senior Li ving Alone
                                10%                                               7%


                                 -59%                                             -46%

                         lower than state average                         lower than state average


                                      * Data Source: American Community Sur vey 5-year estimates


                FY 2025-2026 Annual Budget | Colleyville                                                   Page 17
   12   13   14   15   16   17   18   19   20   21   22