
Page 520 - FY 2025 Adopted Operating Budget and Business Plan
P. 520
Return to Table of Contents
93% 12.64 2.54 76% 0:52 0:49 0:52 5:25 5:29 5:07 5:47 12.41 8.01 0% 685 129 94% 100% 8% 0% 72% 80% 66% 43 days $65.60 100% 76.86 81.97 40 1,668 12 235 1,065 9 44 2,143 318
Sept.
93% 12.63 2.57 80% 0:44 0:47 0:54 5:17 5:12 5:14 5:38 11.34 7.68 92% 619 197 95% 100% 7% 0% 73% 70% $54.95 100% 72.37 79.87 46 196 23 2,108 335
Aug.
93.78% 147.96 1.99 80.79% 0:54 0:48 0:52 5:31 5:00 5:14 5:27 10.76 7.31 90% 707 229 96% 100% 9% 1% 78% 64% $35.64 100% 82.96 79.89 35 163 44 2,233 333
July
91.14% 13.05 2.48 76.76% 0:59 0:48 0:54 5:28 5:59 5:15 5:43 11.77 8.36 0% 587 230 93% 100% 8% 17% 96% 81% 74% 36 days $56.28 100% 75% 80.94 45 1,629 0 178 700 10 63 2,361 357
June
90.22% 15.81 2.44 76.98% 1:02 0:51 0:53 5:37 5:36 5:20 5:58 12.19 8.52 0% 670 238 96% 100% 9% 11% 81% 92% $47.73 100% 78% 78.28 33 240 43 2,432 279
May
91.41% 13.62 2.61 77.94% 0:58 0:51 0:55 5:35 5:15 5:24 5:52 12.83 8.46 87% 832 222 99% 100% 8% 10% 95% 113% $50.14 100% 79% 85.86 37 213 94 2,328 348
April
93.68% 13.02 2.15 81.39% 0:55 0:54 0:58 5:37 5:17 5:21 5:55 11.91 72% 8.17 92% 895 247 99% 100% 9% 12% 152% 150% 67% 41 days $44.34 100% 83% 70% 79.05 47 219 68 932 302
Mar. 1,680 9 10
93.04% 12.79 2.06 80.87% 0:52 0:52 0:55 5:36 5:22 5:18 5:57 11.49 7.79 94% 1,245 336 99% 100% 10% 3% 117% 87% $120.24 100% 86% 82.56 31 192 88 3,131 280
Feb.
94.45% 12.73 2.03 82.07% 0:57 0:53 0:56 5:39 5:37 5:12 5:59 10.97 7.48 0% 1,229 420 99% 100% 11% 5% 89% 96% $55.16 100% 76% 80.29 31 160 88 1,678 462
Jan.
90.69% 12.56 2.54 77.06% 0:55 0:49 0:57 5:27 5:03 5:17 5:52 11.94 8.81 98% 1,322 327 89% 100% 8% 12% 103% 90% $69.81 100% 85% 80.03 54 238 61 2,030 312
Dec. 74% 44 days 1,457 2 999 13
92.15% 12.12 2.95 75.64% 0:58 0:47 0:55 5:29 5:16 5:15 5:53 12.91 8.9 98% 1,386 370 94% 100% 9% 10% 104% 99% $81.37 100% 78% 82.01 40 229 66 2,098 394
Nov.
92.07% 13.07 2.64 76.37% 0:53 0:48 0:55 5:31 5:53 5:15 5:59 12.62 9.28 96% 1,172 341 98% 100% 6% 19% 76% 104% $57.78 100% 84% 77.72 48 227 107 2,319 466
Oct.
FY 2024 Actual 92.32% 23.98 2.42 78.53% 0:54 0:50 0:55 5:31 5:21 5:16 5:51 11.92 72% 8.23 62% 11,349 3,286 96% 100% 103% 100% 92% 90% 70% 41 days $73.48 100% 79% 70% 80.7 487 6,434 23 2,490 2,764 42 789 25,793 4,186
FY 2024 4th Qtr. Actual 93.11% 56.92 2.37 79.01% 0:54 0:50 0:55 5:31 5:21 5:16 5:51 11.5 7.67 67% 22,013 6,443 96% 100% 25% 1% 74% 71% 66% 43 days $52.97 100% 77% 70% 80.57 121 1,668 12 594 1,065 9 111 6,484 986
FY 2024 3rd Qtr. Actual 90.90% 14.2 2.51 77.25% 1:00 0:51 0:54 5:33 5:15 5:24 5:52 12.26 8.46 29% 2,089 690 96% 100% 78% 99% 91% 96% 74% 36 days $68.54 100% 77% 81.69 115 1,629 0 631 700 10 200 7,121 984
FY 2024 2nd Qtr. Actual 93.72% 12.85 2.08 81.57% 0:55 0:53 0:57 5:38 5:27 5:17 5:58 12.49 72% 7.81 62% 3,369 1,003 94% 100% 53% 61% 119% 111% 67% 41 days $68.54 100% 82% 70% 80.62 109 1,680 9 571 10 244 5,741 1,044
FY 2024 1st Qtr. Actual 91.65% 12.91 2.7 76.37% 1:20 1:00 1:20 4:00 5:20 5:00 5:20 12.49 9.0 50% 15,500 2,172 94% 100% 23% 41% 92% 97% 74% 44 days $67.61 100% 82% 79.92 142 1457 2 694 999 13 234 6,447 1,772
90% 25.00 2.00 80% 1:20 1:00 1:20 4:00 5:20 5:00 5:20 13.14 75% 8.1 50% 15,500 2,172 90% 100% 100% 100% 85% 96% 60% 47 Days $72.74 100% 75% 72% < 84.5 < 450 5,400 10 < 3,084 > 3,600 < 24 > 2,000 < 31,260 5,000
FY 2024 Annual Target
92% 13.04 2.62 76% 0:55 0:50 0:53 5:57 5:30 5:31 6:25 12.35 68% 7.9 92% 12,674 3,244 86% 100% 100% 100% 95.87% 94.42% 72% 45 Days $74.23 100% 79% 70% 81.02 527 5,761 39 2,810 3,059 35 2,182 25,552 2,140
FY 2023 Actual
FY 2022 Actual 90.39% 16.38 3.12 72.74% New Measure in FY 2023 New Measure in FY 2023 New Measure in FY 2023 New Measure in FY 2023 New Measure in FY 2023 New Measure in FY 2023 New Measure in FY 2023 13.13 79% 8.05 63.75% 14,033 3,878 70% 100% 100% 100% 93.68% 96.69% 66.75% 41 Days $57.56 100% 84.6% 68% 80.7 567 6,688 10 2,713 3,640 37 2,440 27,599 3,642
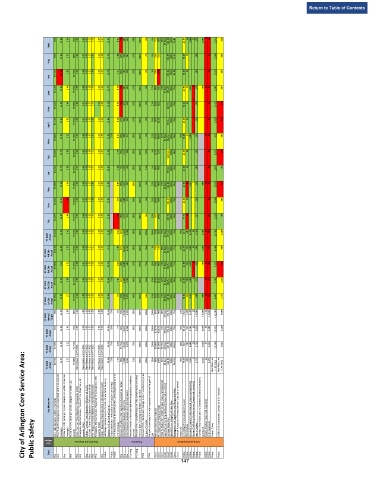
City of Arlington Core Service Area:
FY 2021 Actual 89.73% 13.17 2.17 76.68% 11.86 75% 7.98 68% 11,808 3,042 51% 100% 100% 95% 86% 109% 63% 44 days $49.09 100% 96.31% 70% 78.33 616 7,625 9 2,773 4,525 42 2,375 New Measure in FY 2022 New Measure in FY 2022
Key Measures 9‐1‐1 calls answered within 10 seconds Fire P1 and P2 (emergency) calls dispatched within 25 seconds Police E and P1 (emergency) calls dispatched within 2 minutes Police E and P1 (emergency) calls dispatched within 120 Fires ‐ Turnout Time Objective = 80 seconds (1:20) Emergency Medical Service ‐ Turnout Time Objective = 60 Other ‐ Turnout Time Objective = 80 seconds (1:20) All Calls ‐ Travel Time Objective = 240 seconds (4:00) Fire ‐ Response Time O
Public Safety Goal Category (average) (average) seconds seconds (1:00) Dispatch and Response seconds (5:00) Unit on Scene) on time Prevention to goal of 11,569 338 Percent of Warrants Cleared Cost per Disposition measure] DWI Crashes Injury Crashes Crime and Compliance quarterly] CVE Inspections Overall Crime
Planning
Planning
Dept.
Police
Police
Police
Police
Court
Court
Court
Court
Court
Court
Court
Court
PWK
PWK
Fire
Fire
Fire
Fire
Fire
Fire
Fire
Fire
Fire
Fire
Fire
Fire
Fire
Fire
147 Police Police Police Police Police Police Police Police Police