
Page 164 - FY 24 Budget Forecast at Adoption.xlsx
P. 164
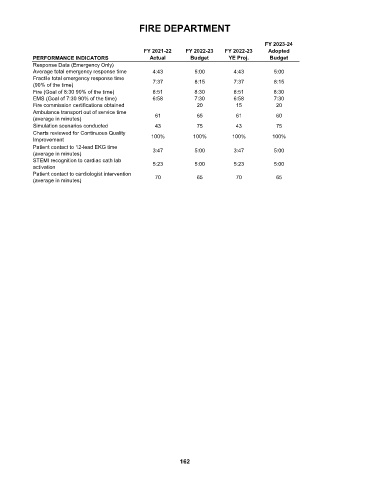
FIRE DEPARTMENT

                                                                                         FY 2023-24
                                                 FY 2021-22   FY 2022-23   FY 2022-23     Adopted
            PERFORMANCE INDICATORS                 Actual       Budget       YE Proj.     Budget
            Response Data (Emergency Only)
            Average total emergency response time   4:43         5:00         4:43          5:00
            Fractile total emergency response time
            (90% of the time)                       7:37         8:15         7:37          8:15
            Fire (Goal of 8:30 90% of the time)     8:51         8:30         8:51          8:30
            EMS (Goal of 7:30 90% of the time)      6:58         7:30         6:58          7:30
            Fire commission certifications obtained               20           15           20
            Ambulance transport out of service time
            (average in minutes)                    61            65           61           60
            Simulation scenarios conducted          43            75           43           75
            Charts reviewed for Continuous Quality
            Improvement                            100%          100%         100%         100%
            Patient contact to 12-lead EKG time     3:47         5:00         3:47          5:00
            (average in minutes)
            STEMI recognition to cardiac cath lab
            activation                              5:23         5:00         5:23          5:00
            Patient contact to cardiologist intervention
            (average in minutes)                    70            65           70           65


                                                             162