
Page 163 - FY 24 Budget Forecast at Adoption.xlsx
P. 163
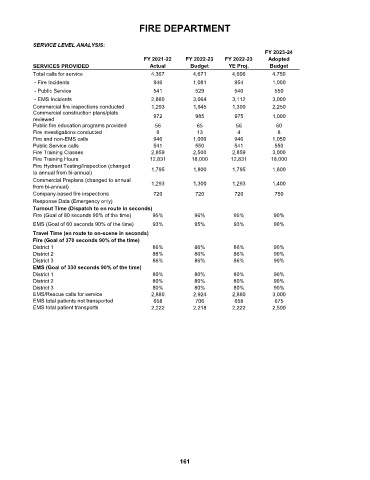
FIRE DEPARTMENT


            SERVICE LEVEL ANALYSIS:
                                                                                         FY 2023-24
                                                 FY 2021-22   FY 2022-23   FY 2022-23     Adopted
            SERVICES PROVIDED                      Actual       Budget       YE Proj.     Budget
            Total calls for service                4,367         4,671        4,606        4,750
             - Fire Incidents                       946          1,081         954         1,000
             - Public Service                       541           529          540          550
             - EMS Incidents                       2,880         3,064        3,112        3,000
            Commercial fire inspections conducted  1,293         1,945        1,300        2,250
            Commercial construction plans/plats
            reviewed                                972           985          975         1,000
            Public fire education programs provided  56           65           56           60
            Fire investigations conducted            9            13            4            8
            Fire and non-EMS calls                  946          1,000         946         1,050
            Public Service calls                    541           550          541          550
            Fire Training Classes                  2,859         2,500        2,859        3,000
            Fire Training Hours                    12,831       18,000       12,831        18,000
            Fire Hydrant Testing/Inspection (changed
            to annual from bi-annual)              1,795         1,800        1,795        1,800
            Commercial Preplans (changed to annual
            from bi-annual)                        1,293         1,300        1,293        1,400
            Company-based fire inspections          720           720          720          750
            Response Data (Emergency only)
            Turnout Time (Dispatch to en route in seconds)
            Fire (Goal of 80 seconds 90% of the time)  95%       96%          95%           90%
            EMS (Goal of 60 seconds 90% of the time)  93%        95%          93%           90%
            Travel Time (en route to on-scene in seconds)
            Fire (Goal of 370 seconds 90% of the time)
            District 1                              86%          86%          86%           90%
            District 2                              86%          86%          86%           90%
            District 3                              86%          86%          86%           90%
            EMS (Goal of 330 seconds 90% of the time)
            District 1                              80%          80%          80%           90%
            District 2                              80%          80%          80%           90%
            District 3                              80%          80%          80%           90%
            EMS/Rescue calls for service           2,880         2,924        2,880        3,000
            EMS total patients not transported      658           706          658          675
            EMS total patient transports           2,222         2,218        2,222        2,500


                                                             161