
Page 507 - Microsoft Word - FY 2022 Adopted Budget Document
P. 507
Return to Table of Contents
80% 100% 94% 6.9% 99% 11% 20,982 27% 77% 67% 22% 1,860 13 20% 73% 97% 100% 6,682 2.48% 948 10,247 3% 100% 92.45% 0.2 5.04 3.93
Sept.
80% 100% 94% 8.2% 99% 14% 21,597 27% 74% 18% 1,941 14 5% 96% 99% 100% 5,043 2.07% 975 10,431 5% 100% 92.45% 0.5 0
Aug.
80% 100% 94% 6.7% 99% 8% 21,473 27% 73% 17% 1,951 12.83 8% 82% 99% 100% 3,516 1.66% 1,079 330 5% 100% 92.45% 0.4 0
July
100% 96% 97% 9.3% 98% 8% 24,726 25% 72% 69% 16% 2,180 9 9% 89% 100% 89% 5,363 1.73% 621 0 12% 100% 91.67% 0.2 0.7 2.79
June
100% 96% 97% 6.1% 98% 6% 20,531 25% 93% 71% 18% 2,190 13 3% 90% 97% 100% 4,226 1.48% 626 3,240 8% 100% 91.97% 0.5 0
May
100% 96% 97% 6.4% 98% 9% 22,945 25% 100% 81% 31% 2,210 15 5% 97% 96% 50% 3,646 1.49% 559 0 16% 100% 91.42% 0.2 0
April
84% 81% 63% 96% 100% 4.9% 99% 12% 23,442 64% 25% 81% 79% 21% 1,898 13 7% 98% 99% 100% 9,265 2% 896 0 16% 100% 90.3% 0.3 1.8 3.61
Mar.
63% 96% 100% 4.9% 99% 35% 18,690 25% 78% 28% 1,540 11 10% 95% 97% 80% 4,858 1.9% 258 5,360 5% 100% 90.87% 0.5 0
Feb.
63% 96% 100% 4.9% 98% 9% 17,889 25% 93% 73% 28% 2,354 15 45.37 13% 100% 98% 100% 6,229 2.2% 309 0 9% 100% 91.82% 0.2 0
Jan.
100% 82% 92% 8.8% 98% 6% 20,667 22% 92% 77% 30% 2,217 10 111 88% 68% 68% 100% 50% 59% 74% 56% 80% 63% 18% 0% 100% 98% 100% 3,636 5.5% 482 0 8% 100% 91.44% 0.2 1.4 3.25
Dec.
100% 82% 92% 8.5% 98% 7% 20,025 22% 98% 79% 23% 1,892 10 96 3% 100% 97% 100% 473 0% 401 403 4% 100% 92.47% 0.5 0
Nov.
100% 82% 92% 6.9% 99% 5% 23,098 22% 94% 74% 28% 2,019 13 0 16% 73% 97% 100% 558 0% 327 176 9% 100% 93.53% 0.2 0
Oct.
84% 81% 81% 96% 96% 6.9% 99% 12% 251,436 64% 25% 83% 71% 21% 23,799 159 252 88% 68% 68% 100% 50% 59% 74% 56% 80% 63% 18% 99% 91% 98% 98% 53,495 22.5% 7,481 30,187 100% 100% 92.45% 4.0 8.90 3.395
FY 2021 Actual
80% 100% 94% 7.3% 98% 11% 64,052 27% 77% 71% 19% 5,751 39 33% 83% 98% 100% 15,241 6.21% 3,002 21,008 13% 100% 92.45% 1.1 5.04 3.93
FY 2021 4th Qtr. Actual
100% 96% 97% 7.5% 98% 8% 68,202 25% 82% 74% 22% 6,127 48 88% 68% 68% 100% 50% 59% 74% 56% 80% 63% 18% 17% 92% 98% 89% 13,235 4.7% 1,806 3,240 36% 100% 91.67% 0.9 0.7 2.79
FY 2021 3rd Qtr. Actual
84% 81% 63% 96% 100% 4.9% 98% 20% 60,021 64% 25% 84% 77% 26% 5,793 38 45 30% 98% 99% 95% 20,352 6.1% 1,463 5,360 30% 100% 90.30% 1.0 1.8 3.61
FY 2021 2nd Qtr. Actual
100% 82% 92% 8.1% 98% 6% 63,790 22% 95% 77% 27% 6,128 34 207 88% 68% 68% 100% 50% 59% 74% 56% 80% 63% 18% 19% 92% 98% 100% 4,667 5.5% 1,210 579 21% 100% 91.44% 1.0 1.4 3.25
FY 2021 1st Qtr. Actual
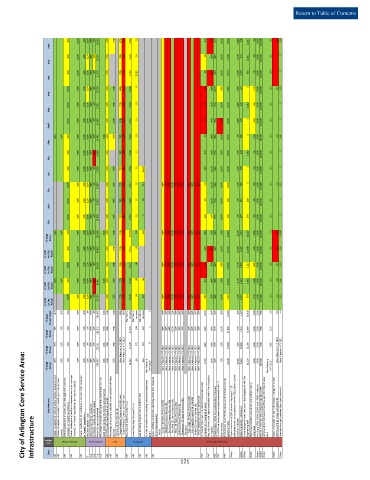
FY 2021 Annual Target 80% 80% 90% 95% 90% 8% 97% 8% 250,000 60% 15% 80% 80% 85% Maintain or Increase Maintain or Increase Maintain or Increase 6 95% 95% 95% 95% 95% 85% 95% 85% 85% 95% 85% 100% 90% 95% 90% 40,000 20% 4,500 30,000 100% 100% 88% ≤ 8 5.8 < 4
78% 75% 92% 93% 72% 6% 97% 12% 265,015 65% 98% 87% 24,250 158 300 2 88% 68% 68% 100% 50% 59% 74% 56% 80% 63% 18% 98% 96% 97% 100% 57,330 27% 7,275 31,099 100% 100% 89% 12.8
FY 2020 Actual
76% 81% 92% 92% 87% 8% 97% 17% 255,281 60% 18% 78% 24,126 172 291 9 99% 91% 97% 91% 70,399 25% 10,394 65,166 100% 100% 91% 6.86
FY 2019 Actual New Measure in FY 2021 New Measure in FY 2021 New Measure in FY 2021 New Measure in FY 2021
City of Arlington Core Service Area:
83% 83% 75% 91% 80% 7.8% 98% 16% 254,557 64% 21% 62% 23,242 180 394 New Measure in FY 2020 New Measure in FY 2020 New Measure in FY 2020 New Measure in FY 2020 New Measure in FY 2020 New Measure in FY 2020 New Measure in FY 2020 New Measure in FY 2020 New Measure in FY 2020 New Measure in FY 2020 New Measure in FY 2020 121% 90% 64% 75% 46,549 16.4% 8,463 81,209 100% 100% 88.94%
FY 2018 Actual New Measure in FY 2019 New Measure in FY 2019
Key Measures Citizen perception of trash collection services [annual survey] Citizen perception of residential recycling services [annual Overall satisfaction of Construction Management’s services “exceeds” or “meets” expectations Overall satisfaction of facility maintenance and repair services “exceeds” or “meets” expectations [surveyed quarterly] Overall satisfaction of custodial services contractor “exceeds” Action Center first call resolution % of Action Cen
Infrastructure Goal Category survey] Satisfaction Ratings or “meets” expectations Helpdesk abandon rate Action Center calls answered Customer Service services Fleet Turnaround Time Standards: Solid Waste given life [annual measures]: Roofs: Elevators: of request business days Infrastructure Maintenance panels annually Overflow Initiative Radio Transmitter installations Engineering staff completed main
Dept.
AM
AM
AM
AM
AM
AM
AM
AM
AM
AM
AM
AM
AM
CLA
CLA
CLA
CLA
IT
121 PWT PWT PWT PWT PWT Water Water Water Water Water Water Water Water Water