
Page 225 - Watauga FY21 Budget
P. 225
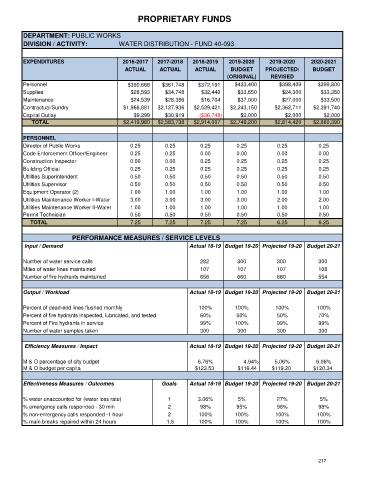
PROPRIETARY FUNDS


      DEPARTMENT: PUBLIC WORKS
      DIVISION / ACTIVITY:            WATER DISTRIBUTION - FUND 40-093

      EXPENDITURES                     2016-2017   2017-2018  2018-2019   2019-2020     2019-2020     2020-2021
                                        ACTUAL     ACTUAL      ACTUAL      BUDGET     PROJECTED/      BUDGET
                                                                          (ORIGINAL)    REVISED
      Personnel                          $390,668   $361,748    $372,191    $433,400       $398,409     $399,800
      Supplies                            $28,593    $34,748     $32,440     $33,650        $24,300      $33,350
      Maintenance                         $24,539    $28,386     $16,704     $37,000        $27,000      $33,500
      Contractual/Sundry               $1,966,881  $2,127,936  $2,529,421  $2,243,150     $2,362,711  $2,391,740
      Capital Outlay                       $9,299    $30,919     ($36,748)    $2,000         $2,000       $2,000
            TOTAL                      $2,419,980  $2,583,738  $2,914,007  $2,749,200     $2,814,420  $2,860,390

      PERSONNEL
      Director of Public Works            0.25       0.25        0.25        0.25         0.25          0.25
      Code Enforcement Officer/Engineer   0.25       0.25        0.00        0.00         0.00          0.00
      Construction Inspector              0.00       0.00        0.25        0.25         0.25          0.25
      Building Official                   0.25       0.25        0.25        0.25         0.25          0.25
      Utilities Superintendent            0.50       0.50        0.50        0.50         0.50          0.50
      Utilities Supervisor                0.50       0.50        0.50        0.50         0.50          0.50
      Equipment Operator (2)              1.00       1.00        1.00        1.00         1.00          1.00
      Utilities Maintenance Worker I-Water  3.00     3.00        3.00        3.00         2.00          2.00
      Utilities Maintenance Worker II-Water  1.00    1.00        1.00        1.00         1.00          1.00
      Permit Technician                   0.50       0.50        0.50        0.50         0.50          0.50
           TOTAL                          7.25       7.25        7.25        7.25         6.25          6.25

                                  PERFORMANCE MEASURES / SERVICE LEVELS
       Input / Demand                                        Actual 18-19 Budget 19-20 Projected 19-20 Budget 20-21


      Number of water service calls                              282         300          300           300
      Miles of water lines maintained                            107         107          107           108
      Number of fire hydrants maintained                         656         660          660           554

      Output / Workload                                      Actual 18-19 Budget 19-20 Projected 19-20 Budget 20-21

      Percent of dead-end lines flushed monthly                 100%        100%          100%          100%
      Percent of fire hydrants inspected, lubricated, and tested  60%        50%          50%           70%
      Percent of Fire hydrants in service                        99%        100%          99%           99%
      Number of water samples taken                              300         300          300           300

       Efficiency Measures / Impact                          Actual 18-19 Budget 19-20 Projected 19-20 Budget 20-21

      M & O percentage of city budget                           6.76%          4.94%      5.06%        6.06%
      M & O budget per capita                                  $123.53       $116.44     $119.20      $120.34

      Effectiveness Measures / Outcomes             Goals    Actual 18-19 Budget 19-20 Projected 19-20 Budget 20-21

      % water unaccounted for (water loss rate)       1         3.06%        5%           27%           5%
      % emergency calls responded - 30 min            2          98%         95%          98%           98%
      % non-emergency calls responded -1 hour         2         100%        100%          100%         100%
      % main breaks repaired within 24 hours          1,5       100%        100%          100%         100%


                                                                                                        217