
Page 229 - Watauga FY21 Budget
P. 229
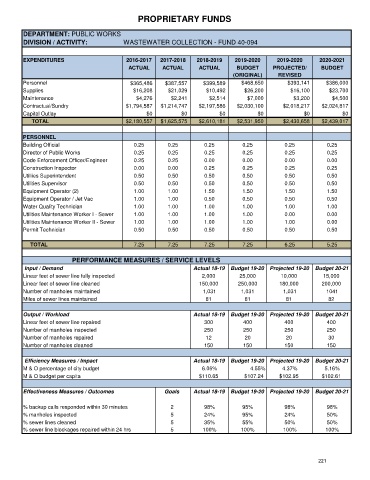
PROPRIETARY FUNDS


      DEPARTMENT: PUBLIC WORKS
      DIVISION / ACTIVITY:             WASTEWATER COLLECTION - FUND 40-094


      EXPENDITURES                      2016-2017   2017-2018   2018-2019   2019-2020     2019-2020     2020-2021
                                         ACTUAL     ACTUAL      ACTUAL       BUDGET      PROJECTED/      BUDGET
                                                                            (ORIGINAL)     REVISED
      Personnel                           $365,486   $387,557     $399,589    $468,650        $393,141     $386,000
      Supplies                             $16,208    $21,029      $10,492     $26,200         $16,100      $23,700
      Maintenance                           $4,276     $2,241       $2,514      $7,000          $3,200      $4,500
      Contractual/Sundry                $1,794,587  $1,214,747  $2,197,586   $2,030,100     $2,018,217   $2,024,817
      Capital Outlay                           $0          $0          $0           $0             $0           $0
            TOTAL                       $2,180,557  $1,625,575  $2,610,181   $2,531,950     $2,430,658   $2,439,017

      PERSONNEL
      Building Official                    0.25       0.25        0.25         0.25          0.25          0.25
      Director of Public Works             0.25       0.25        0.25         0.25          0.25          0.25
      Code Enforcement Officer/Engineer    0.25       0.25        0.00         0.00          0.00          0.00
      Construction Inspector               0.00       0.00        0.25         0.25          0.25          0.25
      Utiliies Superintendent              0.50       0.50        0.50         0.50          0.50          0.50
      Utilities Supervisor                 0.50       0.50        0.50         0.50          0.50          0.50
      Equipment Operator (2)               1.00       1.00        1.50         1.50          1.50          1.50
      Equipment Operator / Jet Vac         1.00       1.00        0.50         0.50          0.50          0.50
      Water Quality Technician             1.00       1.00        1.00         1.00          1.00          1.00
      Utilities Maintenance Worker I - Sewer  1.00    1.00        1.00         1.00          0.00          0.00
      Utilities Maintenance Worker II - Sewer  1.00   1.00        1.00         1.00          1.00          0.00
      Permit Technician                    0.50       0.50        0.50         0.50          0.50          0.50

           TOTAL                           7.25       7.25        7.25         7.25          6.25          5.25

                                  PERFORMANCE MEASURES / SERVICE LEVELS
       Input / Demand                                          Actual 18-19  Budget 19-20  Projected 19-20  Budget 20-21
      Linear feet of sewer line fully inspected                  2,000        25,000        10,000        15,000
      Linear feet of sewer line cleaned                         150,000      250,000       180,000       200,000
      Number of manholes maintained                               1,031       1,031         1,031          1041
      Miles of sewer lines maintained                              81           81           81            82


      Output / Workload                                        Actual 18-19  Budget 19-20  Projected 19-20  Budget 20-21
      Linear feet of sewer line repaired                          300          400           400           400
      Number of manholes inspected                                250          250           250           250
      Number of manholes repaired                                  12           20           20            30
      Number of manholes cleaned                                  150          150           150           150

       Efficiency Measures / Impact                            Actual 18-19  Budget 19-20  Projected 19-20  Budget 20-21
      M & O percentage of city budget                            6.06%           4.55%      4.37%         5.16%
      M & O budget per capita                                   $110.65        $107.24     $102.95       $102.61

      Effectiveness Measures / Outcomes              Goals     Actual 18-19  Budget 19-20  Projected 19-20  Budget 20-21


      % backup calls responded within 30 minutes       2          98%          95%           98%           98%
      % manholes inspected                             5          24%          95%           24%           50%
      % sewer lines cleaned                            5          35%          55%           50%           50%
      % sewer line blockages repaired within 24 hrs    5          100%        100%          100%          100%


                                                                                                        221