
Page 221 - Watauga FY21 Budget
P. 221
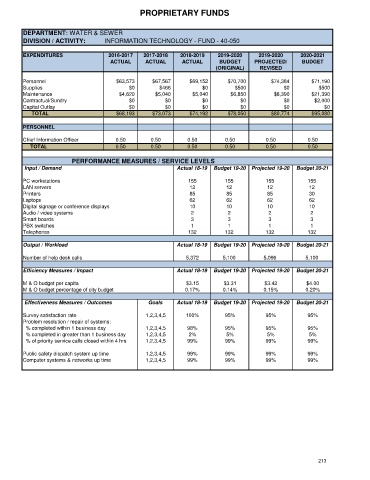
PROPRIETARY FUNDS

      DEPARTMENT: WATER & SEWER
      DIVISION / ACTIVITY:       INFORMATION TECHNOLOGY - FUND - 40-050

      EXPENDITURES                 2016-2017  2017-2018   2018-2019    2019-2020    2019-2020     2020-2021
                                   ACTUAL      ACTUAL      ACTUAL      BUDGET      PROJECTED/      BUDGET
                                                                      (ORIGINAL)     REVISED
      Personnel                      $63,573     $67,567     $69,152      $70,700       $74,384       $71,190
      Supplies                           $0        $466           $0        $500             $0         $500
      Maintenance                     $4,620      $5,040      $5,040       $6,850        $6,390       $21,390
      Contractual/Sundry                 $0          $0           $0          $0             $0        $2,000
      Capital Outlay                     $0          $0           $0          $0             $0           $0
            TOTAL                    $68,193     $73,073     $74,192      $78,050       $80,774       $95,080

      PERSONNEL

      Chief Information Officer      0.50        0.50        0.50        0.50          0.50         0.50
           TOTAL                     0.50        0.50        0.50        0.50          0.50         0.50

                                  PERFORMANCE MEASURES / SERVICE LEVELS
       Input / Demand                                    Actual 18-19  Budget 19-20  Projected 19-20  Budget 20-21

      PC workstations                                        155         155           155          155
      LAN servers                                            12           12           12            12
      Printers                                               85           85           85            30
      Laptops                                                62           62           62            62
      Digital signage or conference displays                 10           10           10            10
      Audio / video systems                                   2           2            2             2
      Smart boards                                            3           3            3             3
      PBX switches                                            1           1            1             1
      Telephones                                             132         132           132          132
      Output / Workload                                  Actual 18-19  Budget 19-20  Projected 19-20  Budget 20-21

      Number of help desk calls                             5,372       5,100         5,096         5,100

      Efficiency Measures / Impact                       Actual 18-19  Budget 19-20  Projected 19-20  Budget 20-21
      M & O budget per capita                               $3.15        $3.31        $3.42         $4.00
      M & O budget percentage of city budget                0.17%       0.14%         0.15%         0.20%
       Effectiveness Measures / Outcomes        Goals    Actual 18-19  Budget 19-20  Projected 19-20  Budget 20-21

      Survey satisfaction rate                 1,2,3,4,5    100%         95%           95%          95%
      Problem resolution / repair of systems:
        % completed within 1 business day      1,2,3,4,5     98%         95%           95%          95%
        % completed in greater than 1 business day  1,2,3,4,5  2%         5%           5%            5%
        % of priority service calls closed within 4 hrs  1,2,3,4,5  99%  99%           99%          99%

      Public safety dispatch system up time    1,2,3,4,5     99%         99%           99%          99%
      Computer systems & networks up time      1,2,3,4,5     99%         99%           99%          99%


                                                                                                        213