
Page 217 - Watauga FY21 Budget
P. 217
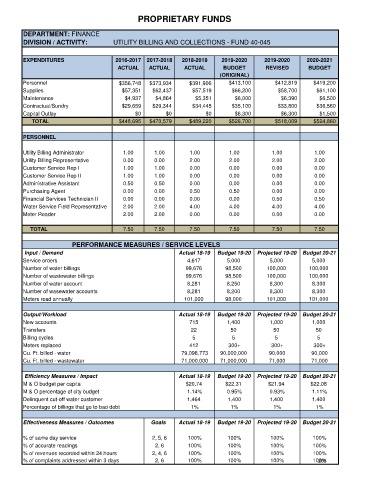
PROPRIETARY FUNDS


      DEPARTMENT: FINANCE
      DIVISION / ACTIVITY:          UTILITY BILLING AND COLLECTIONS - FUND 40-045


      EXPENDITURES                   2016-2017  2017-2018  2018-2019    2019-2020     2019-2020     2020-2021
                                      ACTUAL    ACTUAL      ACTUAL      BUDGET        REVISED        BUDGET
                                                                       (ORIGINAL)
      Personnel                       $356,748  $373,934     $391,906     $413,100        $412,819    $419,200
      Supplies                         $57,351   $62,437      $57,519      $66,200         $58,700     $61,100
      Maintenance                       $4,937    $4,864       $5,351       $6,000          $6,390      $6,500
      Contractual/Sundry               $29,659   $29,344      $34,445      $35,100         $33,800     $36,560
      Capital Outlay                       $0        $0            $0       $6,300          $6,300      $1,500
            TOTAL                     $448,695  $470,579     $489,220     $526,700        $518,009    $524,860

      PERSONNEL

      Utility Billing Administrator    1.00       1.00       1.00         1.00           1.00          1.00
      Urility Billing Representative   0.00       0.00       2.00         2.00           2.00          2.00
      Customer Service Rep I           1.00       1.00       0.00         0.00           0.00          0.00
      Customer Service Rep II          1.00       1.00       0.00         0.00           0.00          0.00
      Administrative Assistant         0.50       0.50       0.00         0.00           0.00          0.00
      Purchasing Agent                 0.00       0.00       0.50         0.50           0.00          0.00
      Financial Services Technician II  0.00      0.00       0.00         0.00           0.50          0.50
      Water Service Field Representative  2.00    2.00       4.00         4.00           4.00          4.00
      Meter Reader                     2.00       2.00       0.00         0.00           0.00          0.00

           TOTAL                       7.50       7.50       7.50         7.50           7.50          7.50

                                  PERFORMANCE MEASURES / SERVICE LEVELS
       Input / Demand                                     Actual 18-19  Budget 19-20  Projected 19-20  Budget 20-21
      Service orders                                         4,617        5,000         5,000         5,000
      Number of water billings                              99,676       98,500        100,000       100,000
      Number of wastewater billings                         99,676       98,500        100,000       100,000
      Number of water account                                8,281        8,250         8,300         8,300
      Number of wasewater accounts                           8,281        8,200         8,300         8,300
      Meters read annually                                  101,000      98,000        101,000       101,000


      Output/Workload                                     Actual 18-19  Budget 19-20  Projected 19-20  Budget 20-21
      New accounts                                           715          1,400         1,000         1,000
      Transfers                                               22           50            50            50
      Billing cycles                                          5            5              5             5
      Meters replaced                                        412          300+          300+          300+
      Cu. Ft. billed - water                               79,098,773  90,000,000       90,000        90,000
      Cu. Ft. billed - wastewater                          71,000,000  71,000,000       71,000        71,000

       Efficiency Measures / Impact                       Actual 18-19  Budget 19-20  Projected 19-20  Budget 20-21
      M & O budget per capita                               $20.74       $22.31        $21.94        $22.08
      M & O percentage of city budget                        1.14%        0.95%         0.93%         1.11%
      Delinquent cut-off water customer                      1,464        1,400         1,400         1,400
      Percentage of billings that go to bad debt              1%           1%            1%            1%

      Effectiveness Measures / Outcomes          Goals    Actual 18-19  Budget 19-20  Projected 19-20  Budget 20-21

      % of same day service                      2, 5, 6     100%         100%          100%          100%
      % of accurate readings                      2, 6       100%         100%          100%          100%
      % of revenues recorded within 24 hours     2, 4, 6     100%         100%          100%          100%
      % of complaints addressed within 3 days     2, 6       100%         100%          100%          100%
                                                                                                        209