
Page 156 - Watauga FY21 Budget
P. 156
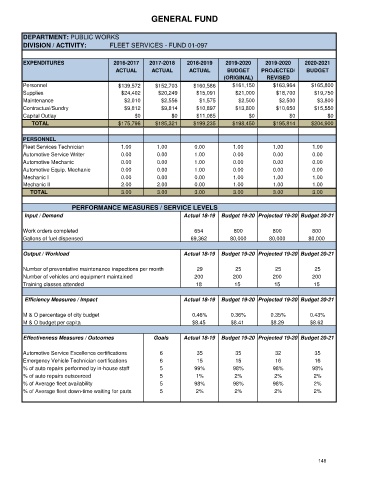
GENERAL FUND


      DEPARTMENT: PUBLIC WORKS
      DIVISION / ACTIVITY:         FLEET SERVICES - FUND 01-097


      EXPENDITURES                  2016-2017   2017-2018   2018-2019    2019-2020    2019-2020    2020-2021
                                     ACTUAL      ACTUAL      ACTUAL       BUDGET     PROJECTED/     BUDGET
                                                                         (ORIGINAL)    REVISED
      Personnel                       $139,572    $152,703     $160,586     $161,150     $163,964     $165,800
      Supplies                         $24,402     $20,249      $15,091      $21,000      $18,700      $19,750
      Maintenance                       $2,010      $2,556       $1,575       $2,500       $2,500       $3,800
      Contractual/Sundry                $9,812      $9,814      $10,897      $13,800      $10,650      $15,550
      Capital Outlay                       $0          $0       $11,085          $0           $0           $0
            TOTAL                     $175,796    $185,321     $199,235     $198,450     $195,814     $204,900

      PERSONNEL
      Fleet Services Technician        1.00        1.00        0.00         1.00         1.00         1.00
      Automotive Service Writer        0.00        0.00        1.00         0.00         0.00         0.00
      Automotive Mechanic              0.00        0.00        1.00         0.00         0.00         0.00
      Automotive Equip. Mechanic       0.00        0.00        1.00         0.00         0.00         0.00
      Mechanic I                       0.00        0.00        0.00         1.00         1.00         1.00
      Mechanic II                      2.00        2.00        0.00         1.00         1.00         1.00
           TOTAL                       3.00        3.00        3.00         3.00         3.00         3.00

                                  PERFORMANCE MEASURES / SERVICE LEVELS
       Input / Demand                                      Actual 18-19  Budget 19-20 Projected 19-20 Budget 20-21

      Work orders completed                                    654          800          800          800
      Gallons of fuel dispensed                               69,362       80,000       80,000       80,000

      Output / Workload                                    Actual 18-19  Budget 19-20 Projected 19-20 Budget 20-21

      Number of preventative maintenance inspections per month  29           25           25           25
      Number of vehicles and equipment maintained              200          200          200          200
      Training classes attended                                18           15           15           15


       Efficiency Measures / Impact                        Actual 18-19  Budget 19-20 Projected 19-20 Budget 20-21

      M & O percentage of city budget                         0.46%        0.36%        0.35%        0.43%
      M & O budget per capita                                 $8.45        $8.41        $8.29        $8.62

      Effectiveness Measures / Outcomes          Goals     Actual 18-19  Budget 19-20 Projected 19-20 Budget 20-21

      Automotive Service Excellence certifications  6           35           35           32           35
      Emergency Vehicle Technician certifications   6           15           15           16           16
      % of auto repairs performed by in-house staff  5         99%          98%          98%          98%
      % of auto repairs outsourced                  5          1%           2%           2%           2%
      % of Average fleet availability               5          98%          98%          98%          2%
      % of Average fleet down-time waiting for parts   5       2%           2%           2%           2%


                                                                                                        148