
Page 152 - Watauga FY21 Budget
P. 152
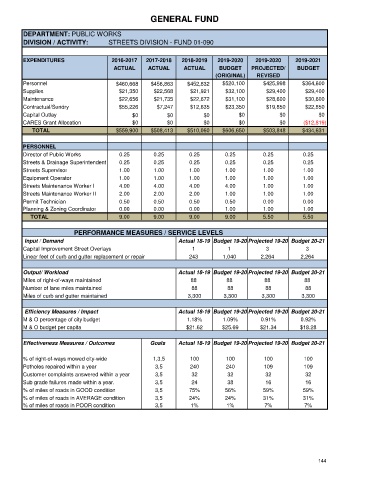
GENERAL FUND


      DEPARTMENT: PUBLIC WORKS
      DIVISION / ACTIVITY:         STREETS DIVISION - FUND 01-090


      EXPENDITURES                  2016-2017  2017-2018   2018-2019   2019-2020   2019-2020    2019-2021
                                    ACTUAL      ACTUAL     ACTUAL      BUDGET     PROJECTED/     BUDGET
                                                                      (ORIGINAL)    REVISED
      Personnel                      $460,668    $456,863    $452,832   $520,100      $425,998     $364,600
      Supplies                        $21,350     $22,568     $21,921    $32,100       $29,400      $29,400
      Maintenance                     $22,656    $21,735      $22,672    $31,100       $28,600      $30,600
      Contractual/Sundry              $55,226     $7,247      $12,635    $23,350       $19,850      $22,850
      Capital Outlay                      $0          $0          $0          $0           $0           $0
      CARES Grant Allocation              $0          $0          $0          $0           $0      ($12,819)
            TOTAL                    $559,900    $508,413    $510,060   $606,650      $503,848     $434,631

      PERSONNEL
      Director of Public Works        0.25       0.25        0.25        0.25         0.25         0.25
      Streets & Drainage Superintendent  0.25    0.25        0.25        0.25         0.25         0.25
      Streets Supervisor              1.00       1.00        1.00        1.00         1.00         1.00
      Equipment Operator              1.00       1.00        1.00        1.00         1.00         1.00
      Streets Maintenance Worker I    4.00       4.00        4.00        4.00         1.00         1.00
      Streets Maintenance Worker II   2.00       2.00        2.00        1.00         1.00         1.00
      Permit Technician               0.50       0.50        0.50        0.50         0.00         0.00
      Planning & Zoning Coordinator   0.00       0.00        0.00        1.00         1.00         1.00
           TOTAL                      9.00       9.00        9.00        9.00         5.50         5.50


                                  PERFORMANCE MEASURES / SERVICE LEVELS
       Input / Demand                                     Actual 18-19 Budget 19-20 Projected 19-20 Budget 20-21
      Capital Improvement Street Overlays                     1           1            3            3
      Linear feet of curb and gutter replacement or repair   243        1,040        2,264        2,264

      Output/ Workload                                    Actual 18-19 Budget 19-20 Projected 19-20 Budget 20-21
      Miles of right-of-ways maintained                       88          88          88           88
      Number of lane miles maintained                         88          88          88            88
      Miles of curb and gutter maintained                    3,300       3,300       3,300        3,300

       Efficiency Measures / Impact                       Actual 18-19 Budget 19-20 Projected 19-20 Budget 20-21
      M & O percentage of city budget                       1.18%       1.09%        0.91%        0.92%
      M & O budget per capita                               $21.62      $25.69       $21.34       $18.28

      Effectiveness Measures / Outcomes         Goals     Actual 18-19 Budget 19-20 Projected 19-20 Budget 20-21


      % of right-of-ways mowed city-wide         1,3,5        100        100          100          100
      Potholes repaired within a year             3,5         240        240          109          109
      Customer complaints answered within a year   3,5        32          32          32            32
      Sub grade failures made within a year.      3,5         24          38          16            16
      % of miles of roads in GOOD condition       3,5        75%         56%          59%          59%
      % of miles of roads in AVERAGE condition    3,5        24%         24%          31%          31%
      % of miles of roads in POOR condition       3,5         1%          1%          7%           7%


                                                                                                        144