
Page 160 - Watauga FY21 Budget
P. 160
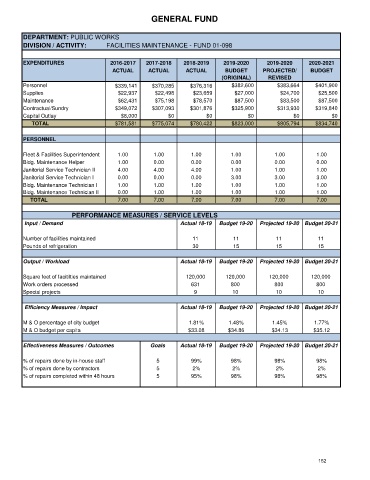
GENERAL FUND


      DEPARTMENT: PUBLIC WORKS
      DIVISION / ACTIVITY:        FACILITIES MAINTENANCE - FUND 01-098


      EXPENDITURES                 2016-2017   2017-2018   2018-2019     2019-2020     2019-2020     2020-2021
                                    ACTUAL      ACTUAL      ACTUAL       BUDGET       PROJECTED/     BUDGET
                                                                        (ORIGINAL)     REVISED
      Personnel                      $339,141    $370,285     $376,316     $382,600       $383,664     $401,900
      Supplies                        $22,937     $22,498      $23,659      $27,000        $24,700      $25,500
      Maintenance                     $62,431     $75,198      $78,570      $87,500        $83,500      $87,500
      Contractual/Sundry             $349,072    $307,093     $301,876     $325,900       $313,930     $319,840
      Capital Outlay                   $8,000         $0           $0            $0             $0          $0
            TOTAL                    $781,581    $775,074     $780,422     $823,000       $805,794     $834,740

      PERSONNEL


      Fleet & Facilities Superintendent  1.00    1.00         1.00         1.00          1.00          1.00
      Bldg. Maintenance Helper        1.00       0.00         0.00         0.00          0.00          0.00
      Janitorial Service Technician II  4.00     4.00         4.00         1.00          1.00          1.00
      Janitorial Service Technician I  0.00      0.00         0.00         3.00          3.00          3.00
      Bldg. Maintenance Technician I  1.00       1.00         1.00         1.00          1.00          1.00
      Bldg. Maintenance Technician II  0.00      1.00         1.00         1.00          1.00          1.00
           TOTAL                      7.00       7.00         7.00         7.00          7.00          7.00

                                  PERFORMANCE MEASURES / SERVICE LEVELS
       Input / Demand                                     Actual 18-19  Budget 19-20  Projected 19-20  Budget 20-21

      Number of facilities maintained                         11            11            11            11
      Pounds of refrigeration                                 30            15            15            15


      Output / Workload                                   Actual 18-19  Budget 19-20  Projected 19-20  Budget 20-21

      Square feet of facitilties maintained                 120,000      120,000        120,000       120,000
      Work orders processed                                   631          800           800           800
      Special projects                                         9            10            10            10

       Efficiency Measures / Impact                       Actual 18-19  Budget 19-20  Projected 19-20  Budget 20-21

      M & O percentage of city budget                        1.81%        1.48%          1.45%         1.77%
      M & O budget per capita                                $33.08       $34.86         $34.13       $35.12

      Effectiveness Measures / Outcomes         Goals     Actual 18-19  Budget 19-20  Projected 19-20  Budget 20-21

      % of repairs done by in-house staff         5           99%          98%           98%           98%
      % of repairs done by contractors            5           2%            2%            2%            2%
      % of repairs completed within 48 hours      5           95%          98%           98%           98%


                                                                                                        152