
Page 123 - Watauga FY21 Budget
P. 123
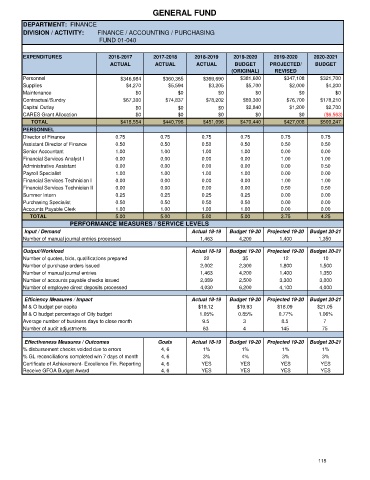
GENERAL FUND
      DEPARTMENT:  FINANCE
      DIVISION / ACTIVITY:     FINANCE / ACCOUNTING / PURCHASING
                                                  FUND 01-040


      EXPENDITURES                 2016-2017     2017-2018     2018-2019    2019-2020    2019-2020    2020-2021
                                   ACTUAL         ACTUAL        ACTUAL      BUDGET      PROJECTED/     BUDGET
                                                                           (ORIGINAL)     REVISED
      Personnel                       $346,984      $360,365      $369,690    $381,600       $347,108    $321,700
      Supplies                          $4,270        $5,594        $3,205      $5,700        $2,000      $4,200
      Maintenance                           $0           $0            $0          $0             $0          $0
      Contractual/Sundry               $67,300       $74,837       $78,202     $80,300       $76,700     $178,210
      Capital Outlay                        $0           $0            $0       $2,840        $1,200      $2,700
      CARES Grant Allocation                $0           $0            $0          $0             $0      ($6,563)
            TOTAL                     $418,554      $440,796      $451,096    $470,440       $427,008    $500,247
      PERSONNEL
      Director of Finance            0.75           0.75         0.75         0.75          0.75         0.75
      Assistant Director of Finance  0.50           0.50         0.50         0.50          0.50         0.50
      Senior Accountant              1.00           1.00         1.00         1.00          0.00         0.00
      Financial Services Analyst I   0.00           0.00         0.00         0.00          1.00         1.00
      Administrative Assistant       0.00           0.00         0.00         0.00          0.00         0.50
      Payroll Specialist             1.00           1.00         1.00         1.00          0.00         0.00
      Financial Services Technician I  0.00         0.00         0.00         0.00          1.00         1.00
      Financial Services Technician II  0.00        0.00         0.00         0.00          0.50         0.50
      Summer Intern                  0.25           0.25         0.25         0.25          0.00         0.00
      Purchasing Specialist          0.50           0.50         0.50         0.50          0.00         0.00
      Accounts Payable Clerk         1.00           1.00         1.00         1.00          0.00         0.00
           TOTAL                     5.00           5.00         5.00         5.00          3.75         4.25
                                  PERFORMANCE MEASURES / SERVICE LEVELS
       Input / Demand                                         Actual 18-19  Budget 19-20  Projected 19-20  Budget 20-21
      Number of manual journal entries processed                 1,463        4,200        1,400        1,350

      Output/Workload                                         Actual 18-19  Budget 19-20  Projected 19-20  Budget 20-21
      Number of quotes, bids, qualifications prepared             22           35           12           10
      Number of purchase orders issued                           2,002        2,300        1,800        1,500
      Number of manual journal entries                           1,463        4,200        1,400        1,350
      Number of accounts payable checks issued                   2,389        2,500        3,300        3,000
      Number of employee direct deposits processed               4,030        6,200        4,100        4,000

       Efficiency Measures / Impact                           Actual 18-19  Budget 19-20  Projected 19-20  Budget 20-21
      M & O budget per capita                                   $19.12       $19.93       $18.09        $21.05
      M & O budget percentage of City budget                     1.05%       0.85%         0.77%        1.06%
      Average number of business days to close month              9.5          3            8.5           7
      Number of audit adjustments                                 63           4            145          75
       Effectiveness Measures / Outcomes           Goals      Actual 18-19  Budget 19-20  Projected 19-20  Budget 20-21
      % disbursement checks voided due to errors    4, 6          1%           1%           1%           1%
      % GL reconciliations completed w/n 7 days of month  4, 6    3%           4%           3%           3%
      Certificate of Achievement- Excellence Fin. Reporting  4, 6  YES        YES           YES          YES
      Receive GFOA Budget Award                     4, 6         YES          YES           YES          YES


                                                                                                        115