
Page 234 - Manfield FY21 Budget
P. 234
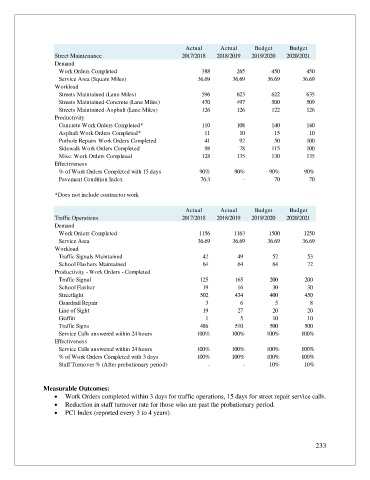
Actual      Actual     Budget      Budget
                   Street Maintenance                        2017/2018   2018/2019  2019/2020   2020/2021
                   Demand
                    Work Orders Completed                           388        265         450        450
                    Service Area (Square Miles)                   36.69       36.69       36.69      36.69
                   Workload
                    Streets Maintained (Lane Miles)                 596        623         622        635
                    Streets Maintained-Concrete (Lane Miles)        470        497         500        509
                    Streets Maintained-Asphalt (Lane Miles)         126        126         122        126
                   Productivity
                    Concrete Work Orders Completed*                 110        108         140        140
                    Asphalt Work Orders Completed*                   11         10          15         10
                    Pothole Repairs Work Orders Completed            41         92          50        100
                    Sidewalk Work Orders Completed                   98         78         115        100
                    Misc. Work Orders Completed                     128        135         130        135
                   Effectiveness
                    % of Work Orders Completed with 15 days        90%         90%        90%         90%
                    Pavement Condition Index                       76.3          -          70         70

                   *Does not include contractor work

                                                              Actual      Actual     Budget      Budget
                   Traffic Operations                        2017/2018   2018/2019  2019/2020   2020/2021
                   Demand
                    Work Orders Completed                          1156       1163        1500       1250
                    Service Area                                  36.69       36.69       36.69      36.69
                   Workload

                    Traffic Signals Maintained                                42                    49                      52                    53


                    School Flashers Maintained                                64                      64                      64                    72

                   Productivity - Work Orders - Completed


                    Traffic Signal                                            125                    165                  200                  200

                    School Flasher                                              19                      16                      30                    30

                    Streetlight                                               502                    434                  400                    450


                    Guardrail Repair                                            3                      6                      5                        8


                    Line of Sight                                             19                    27                      20                    20

                    Graffiti                                                    1                      5                        10                      10


                    Traffic Signs                                             486                  510                  500                  500
                    Service Calls answered within 24 hours        100%        100%       100%        100%
                   Effectiveness
                    Service Calls answered within 24 hours        100%        100%       100%        100%
                    % of Work Orders Completed with 3 days        100%        100%       100%        100%
                    Staff Turnover % (After probationary period)      -          -        10%         10%


               Measurable Outcomes:
                   •  Work Orders completed within 3 days for traffic operations, 15 days for street repair service calls.
                   •  Reduction in staff turnover rate for those who are past the probationary period.
                   •  PCI Index (reported every 3 to 4 years).


                                                                                                         233