
Page 88 - Grapevine Budget FY21
P. 88
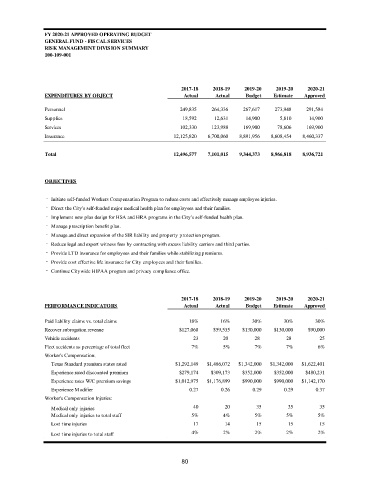
FY 2020-21 APPROVED OPERATING BUDGET
                GENERAL FUND - FISCAL SERVICES
                RISK MANAGEMENT DIVISION SUMMARY
                100-109-001


                                                             2017-18   2018-19    2019-20   2019-20    2020-21
                EXPENDITURES BY OBJECT                        Actual    Actual    Budget   Estimate   Approved

                Personnel                                         249,835           264,336           267,617           273,948           291,584
                Supplies                                            18,592             12,631             14,900               5,810             14,900
                Services                                          102,330           123,988           169,900             78,606           169,900
                Insurance                                    12,125,820        6,700,060        8,891,956        8,608,454        8,460,337


                Total                                        12,496,577        7,101,015        9,344,373        8,966,818        8,936,721


                OBJECTIVES

                 -  Initiate self-funded Workers Compensation Program to reduce costs and effectively manage employee injuries.
                - Direct the City's self-funded major medical health plan for employees and their families.
                - Implement new plan design for HSA and HRA programs in the City's self-funded health plan.
                - Manage prescription benefit plan.
                - Manage and direct expansion of the SIR liability and property protection program.
                - Reduce legal and expert witness fees by contracting with excess liability carriers and third parties.
                - Provide LTD insurance for employees and their families while stabilizing premiums.
                - Provide cost effective life insurance for City employees and their families.
                - Continue Citywide HIPAA program and privacy compliance office.


                                                             2017-18   2018-19    2019-20   2019-20    2020-21
                PERFORMANCE INDICATORS                        Actual    Actual    Budget   Estimate   Approved


                Paid liability claims vs. total claims          18%       16%       30%        30%       30%
                Recover subrogation revenue                 $127,068    $59,535  $130,000   $130,000   $90,000
                Vehicle accidents                                23        20        28         28         25
                Fleet accidents as percentage of total fleet    7%         5%        7%         7%        6%
                Worker's Compensation:
                  Texas Standard premium states rated      $1,292,149  $1,486,072  $1,342,000  $1,342,000  $1,622,401
                  Experience rated discounted premium       $279,174   $309,173  $352,000   $352,000  $480,231
                  Experience rates W/C premium savings     $1,012,975  $1,176,899  $990,000  $990,000  $1,142,170
                  Experience Modifier                           0.27      0.26       0.29      0.29      0.37
                Worker's Compensation Injuries:

                  Medical only injuries                          40        20         35        35         35
                  Medical only injuries to total staff          5%         4%        5%         5%        5%
                  Lost time injuries                             17        14         15        15         15
                  Lost time injuries to total staff             4%         2%        2%         2%        2%


                                                             80