
Page 66 - Grapevine Budget FY21
P. 66
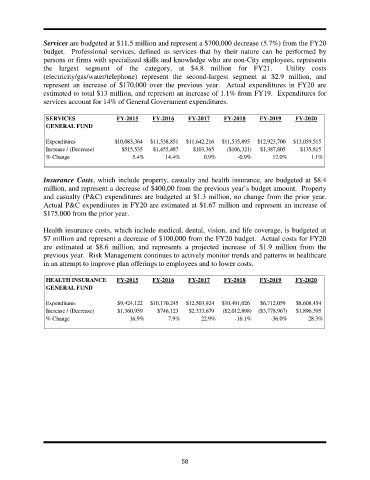
Services are budgeted at $11.5 million and represent a $700,000 decrease (5.7%) from the FY20
               budget.   Professional services, defined as services that by their nature can be performed by
               persons or firms with specialized skills and knowledge who are non-City employees, represents
               the largest segment of the category,  at $4.8  million for FY21.   Utility costs
               (electricity/gas/water/telephone) represent the second-largest segment at $2.9  million, and
               represent an increase of $170,000 over the previous  year.   Actual expenditures in  FY20  are
               estimated to total $13 million, and represent an increase of 1.1% from FY19.  Expenditures for
               services account for 14% of General Government expenditures.

                SERVICES                FY-2015    FY-2016     FY-2017     FY-2018     FY-2019     FY-2020
                GENERAL FUND

                Expenditures           $10,083,364  $11,538,851  $11,642,216  $11,535,895  $12,923,700  $13,059,515
                Increase / (Decrease)    $515,535   $1,455,487   $103,365   ($106,321)  $1,387,805  $135,815
                % Change                     5.4%       14.4%       0.9%        -0.9%      12.0%        1.1%

               Insurance Costs, which include property, casualty and health insurance, are budgeted at $8.4
               million, and represent a decrease of $400,00 from the previous year’s budget amount.  Property
               and casualty (P&C) expenditures are budgeted at $1.3 million, no change from the prior year.
               Actual P&C expenditures in FY20 are estimated at $1.67 million and represent an increase of
               $175,000 from the prior year.

               Health insurance costs, which include medical, dental, vision, and life coverage, is budgeted at
               $7 million and represent a decrease of $100,000 from the FY20 budget.  Actual costs for FY20
               are  estimated at $8.6  million,  and  represents a  projected  increase  of $1.9  million  from the
               previous year.  Risk Management continues to actively monitor trends and patterns in healthcare
               in an attempt to improve plan offerings to employees and to lower costs.


                HEALTH INSURANCE        FY-2015    FY-2016     FY-2017     FY-2018     FY-2019     FY-2020
                GENERAL FUND


                Expenditures            $9,424,122  $10,170,245  $12,503,924  $10,491,026  $6,712,059  $8,608,454
                Increase / (Decrease)   $1,360,959   $746,123  $2,333,679  ($2,012,898)  ($3,778,967)  $1,896,395
                % Change                    16.9%        7.9%       22.9%      -16.1%      -36.0%      28.3%


                                                             58