
Page 62 - Grapevine Budget FY21
P. 62
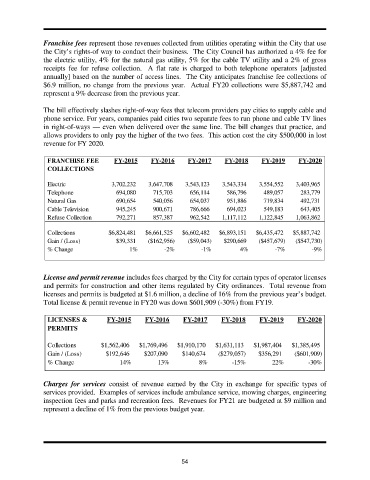
Franchise fees represent those revenues collected from utilities operating within the City that use
               the City’s rights-of way to conduct their business.  The City Council has authorized a 4% fee for
               the electric utility, 4% for the natural gas utility, 5% for the cable TV utility and a 2% of gross
               receipts fee  for refuse  collection.  A flat rate is charged to both telephone operators [adjusted
               annually] based on the number of access lines.  The City anticipates franchise fee collections of
               $6.9 million, no change from the previous year.  Actual FY20 collections were $5,887,742 and
               represent a 9% decrease from the previous year.

               The bill effectively slashes right-of-way fees that telecom providers pay cities to supply cable and
               phone service. For years, companies paid cities two separate fees to run phone and cable TV lines
               in right-of-ways — even when delivered over the same line. The bill changes that practice, and
               allows providers to only pay the higher of the two fees.  This action cost the city $500,000 in lost
               revenue for FY 2020.

                 FRANCHISE FEE         FY-2015     FY-2016     FY-2017     FY-2018      FY-2019     FY-2020
                 COLLECTIONS

                 Electric             3,702,232   3,647,708   3,543,123    3,543,334   3,554,552   3,403,965
                 Telephone             694,080      715,703     656,114     586,796     489,057     283,779
                 Natural Gas           690,654      540,056     654,037     951,886     719,834     492,731
                 Cable Television      945,245      900,671     786,666     694,023     549,183     643,405
                 Refuse Collection     792,271      857,387     962,542    1,117,112   1,122,845   1,063,862

                 Collections         $6,824,481  $6,661,525  $6,602,482   $6,893,151  $6,435,472  $5,887,742
                 Gain / (Loss)         $39,331    ($162,956)   ($59,043)   $290,669    ($457,679)  ($547,730)
                 % Change                   1%         -2%          -1%         4%          -7%         -9%


               License and permit revenue includes fees charged by the City for certain types of operator licenses
               and permits for construction and other items regulated by City ordinances.  Total revenue from
               licenses and permits is budgeted at $1.6 million, a decline of 16% from the previous year’s budget.
               Total license & permit revenue in FY20 was down $601,909 (-30%) from FY19.


                 LICENSES &         FY-2015      FY-2016      FY-2017     FY-2018      FY-2019     FY-2020
                 PERMITS

                 Collections      $1,562,406   $1,769,496   $1,910,170  $1,631,113   $1,987,404   $1,385,495
                 Gain / (Loss)      $192,646     $207,090    $140,674    ($279,057)    $356,291   ($601,909)
                 % Change                14%         13%           8%         -15%         22%         -30%

               Charges for  services  consist of revenue  earned  by the City in  exchange for specific types of
               services provided.  Examples of services include ambulance service, mowing charges, engineering
               inspection fees and parks and recreation fees.  Revenues for FY21 are budgeted at $9 million and
               represent a decline of 1% from the previous budget year.


                                                             54