
Page 205 - Grapevine Budget FY21
P. 205
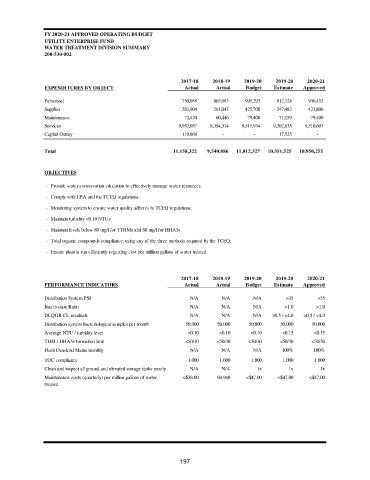
FY 2020-21 APPROVED OPERATING BUDGET
                UTILITY ENTERPRISE FUND
                WATER TREATMENT DIVISION SUMMARY
                200-530-002


                                                             2017-18   2018-19    2019-20   2019-20    2020-21
                EXPENDITURES BY OBJECT                        Actual     Actual   Budget    Estimate  Approved

                Personnel                                          730,058           865,083           995,293           812,724           936,452
                Supplies                                           283,904           261,043           425,700           247,482           423,800
                Maintenance                                          72,434             60,446             79,400             71,159             79,400
                Services                                         9,952,057         8,354,314         9,511,934         9,202,635         9,510,603
                Capital Outlay                                     119,869                  -                   -              17,525                  -


                Total                                       11,158,322       9,540,886     11,012,327     10,351,525     10,950,255
                OBJECTIVES
                - Provide water conservation education to effectively manage water resources.
                - Comply with EPA and the TCEQ regulations.
                - Monitoring system to ensure water quality adheres to TCEQ regulations.
                - Maintain turbidity <0.10 NTUs

                - Maintain levels below 80 mg/l for TTHMs and 60 mg/l for HHA5s.
                - Total organic compounds compliance, using any of the three methods required by the TCEQ.
                - Ensure plant is run efficiently regarding cost per milllion gallons of water treated.


                                                             2017-18   2018-19    2019-20   2019-20    2020-21
                PERFORMANCE INDICATORS                        Actual     Actual   Budget    Estimate  Approved

                Distribution System PSI                         N/A       N/A        N/A        >35       >35
                Inactivation Ratio                              N/A       N/A        N/A       >1.0       >1.0
                DLQOR CL residuals                              N/A       N/A        N/A   >0.5 / <4.0  >0.5 / <4.0
                Distribution system bacteriological samples per month   50.000  50.000  50.000  50.000  50.000
                Average NTU / turbidity level                  <0.10      <0.10     <0.10     <0.15      <0.15
                THM / HHA5s formation limit                   <50/30     <50/30    <50/30     <50/30    <50/30
                Flush Deadend Mains monthly                     N/A       N/A        N/A      100%       100%
                TOC compliance                                 1.000      1.000     1.000      1.000     1.000
                Clean and inspect all ground and elevated storage tanks yearly  N/A  N/A  1x     1x        1x
                Maintenance costs (quarterly) per million gallons of water   <$38.00  60.940  <$47.00  <$47.00  <$47.00
                treated


                                                             197