Page 208 - Grapevine Budget FY21
P. 208

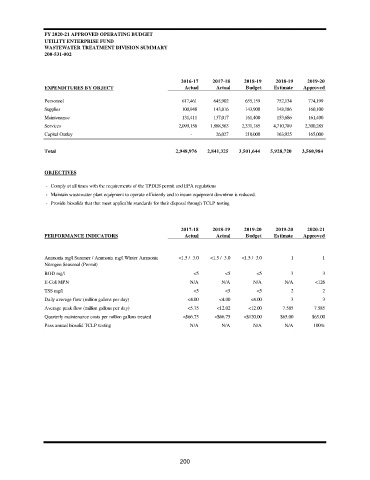
FY 2020-21 APPROVED OPERATING BUDGET
                UTILITY ENTERPRISE FUND
                WASTEWATER TREATMENT DIVISION SUMMARY
                200-531-002


                                                             2016-17   2017-18    2018-19   2018-19    2019-20
                EXPENDITURES BY OBJECT                        Actual     Actual   Budget    Estimate  Approved

                Personnel                                          617,461           645,902           655,159           752,134           774,199
                Supplies                                           100,948           143,816           143,900           148,186           160,100
                Maintenance                                        131,411           137,017           161,400           153,686           161,400
                Services                                         2,099,156         1,888,563         2,331,185         4,710,789         2,300,285
                Capital Outlay                                            -              26,027           210,000           163,925           165,000


                Total                                         2,948,976       2,841,325       3,501,644       5,928,720       3,560,984
                OBJECTIVES
                - Comply at all times with the requirements of the TPDES permit and EPA regulations
                - Maintain wastewater plant equipment to operate efficiently and to insure equipment downtime is reduced.
                - Provide biosolids that that meet applicable standards for their disposal through TCLP testing


                                                             2017-18   2018-19    2019-20   2019-20    2020-21
                PERFORMANCE INDICATORS                        Actual     Actual   Budget    Estimate  Approved


                Ammonia mg/l Summer / Ammonia mg/l Winter Ammonia   <1.5 /  3.0  <1.5 /  3.0  <1.5 /  3.0  1  1
                Nitrogen Seasonal (Permit)
                BOD mg/l                                         <5         <5        <5         3          3
                E-Coli MPN                                      N/A       N/A        N/A       N/A       <126
                TSS mg/l                                         <5         <5        <5         2          2
                Daily average flow (million gallons per day)   <4.00      <4.00     <4.00        3          3
                Average peak flow (million gallons per day)    <5.75     <12.02    <12.00      7.585     7.585
                Quarterly maintenance costs per million gallons treated  <$66.75  <$66.75  <$120.00  $65.00  $65.00
                Pass annual biosolid TCLP testing               N/A       N/A        N/A       N/A       100%


                                                             200
   203   204   205   206   207   208   209   210   211   212   213