Page 200 - Grapevine Budget FY21
P. 200

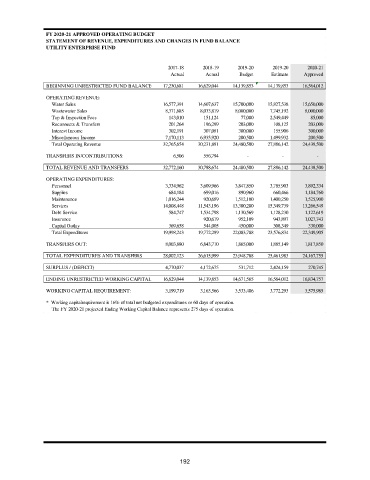
FY 2020-21 APPROVED OPERATING BUDGET
                STATEMENT OF REVENUE, EXPENDITURES AND CHANGES IN FUND BALANCE
                UTILITY ENTERPRISE FUND


                                                         2017-18    2018-19     2019-20    2019-20     2020-21
                                                          Actual     Actual     Budget     Estimate   Approved
                BEGINNING UNRESTRICTED FUND BALANCE          17,230,681          16,629,044          14,139,853          14,139,853          16,564,012
                OPERATING REVENUE:
                  Water Sales                                 16,577,391          14,607,637          15,700,000          15,827,538          15,650,000
                  Wastewater Sales                            8,371,685           8,033,819           8,000,000           7,745,192           8,000,000
                  Tap & Inspection Fees                          143,010              151,124                77,000           2,549,449                85,000
                  Reconnects & Transfers                         201,264              196,299              203,000              108,125              203,000
                  Interest Income                                302,191              307,081              300,000              155,906              300,000
                  Miscellaneous Income                        7,170,113           6,935,920              200,500           1,499,932              200,500
                  Total Operating Revenue                     32,765,654          30,231,881          24,480,500          27,886,142          24,438,500

                TRANSFERS IN/CONTRIBUTIONS:                          6,506              556,794                    -                      -                        -
                TOTAL REVENUE AND TRANSFERS                   32,772,160          30,788,674          24,480,500          27,886,142          24,438,500
                OPERATING EXPENDITURES:
                  Personnel                                   3,334,962           3,609,966           3,847,850           3,785,903           3,892,334
                  Supplies                                       684,184              699,016              890,960              660,466           1,184,760
                  Maintenance                                 1,016,244              920,689           1,512,100           1,400,250           1,525,900

                  Services                                  14,008,448          11,543,196          13,300,200          15,349,739          13,266,549
                  Debt Service                                   584,747           1,534,798           1,130,569           1,128,230           1,122,619
                  Insurance                                            -               920,619              952,109              943,897           1,027,743
                  Capital Outlay                                 369,658              544,005              450,000              308,349              330,000
                  Total Expenditures                          19,998,243          19,772,289          22,083,788          23,576,834          22,349,905

                TRANSFERS OUT:                                8,003,880           6,843,710           1,865,000           1,885,149           1,817,850

                TOTAL EXPENDITURES AND TRANSFERS            28,002,123          26,615,999          23,948,788          25,461,983          24,167,755
                SURPLUS / (DEFICIT)                           4,770,037           4,172,675              531,712           2,424,159              270,745

                ENDING UNRESTRICTED WORKING CAPITAL          16,629,044          14,139,853          14,671,565          16,564,012          16,834,757
                WORKING CAPITAL REQUIREMENT:                  3,199,719           3,163,566           3,533,406           3,772,293           3,575,985

                *  Working capitalrequirement is 16% of total net budgeted expenditures or 60 days of operation.
                  The FY 2020-21 projected Ending Working Capital Balance represents 275 days of operation.


                                                             192
   195   196   197   198   199   200   201   202   203   204   205