
Page 39 - City of Westlake FY20 Budget
P. 39
Section 1 Executive
Strategic Plan
OBJECTIVES AND PERFORMANCE MEASURES
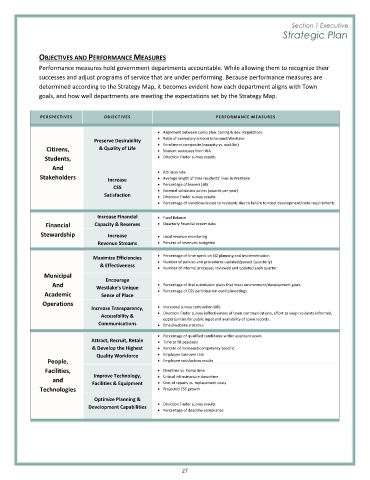
Performance measures hold government departments accountable. While allowing them to recognize their
successes and adjust programs of service that are under performing. Because performance measures are
determined according to the Strategy Map, it becomes evident how each department aligns with Town
goals, and how well departments are meeting the expectations set by the Strategy Map.
PERSPECTIVES OBJECTIVES PERFORMANCE MEASURES
• Alignment between comp plan, zoning & dev. Regulations
Preserve Desirability • Ratio of exemplary schools in/around Westlake
Citizens, & Quality of Life • Enrollment composite (capacity vs. wait list)
• Student successes from WA
Students, • Direction Finder survey results
And
Stakeholders Increase • Attrition rate
• Average length of time residents’ lives in Westlake
CSS • Percentage of leavers (all)
• External validation points (awards per year)
Satisfaction • Direction Finder survey results
• Percentage of violations issued to residents due to failure to meet development/code requirements
Increase Financial • Fund Balance
Financial Capacity & Reserves • Quarterly financial report data
Stewardship Increase • Local revenue monitoring
Revenue Streams • Percent of revenues budgeted
Maximize Efficiencies • Percentage of time spent on Q2 planning and implementation
& Effectiveness • Number of policies and procedures updated/passed (quarterly)
• Number of internal processes reviewed and updated each quarter
Municipal Encourage
And Westlake’s Unique • Percentage of first submission plans that meet environment/development goals
Academic Sense of Place • Percentage of CSS participation events/meetings
Operations
Increase Transparency, • Increased survey completion (All)
Accessibility & • Direction Finder survey (effectiveness of town communications, effort to keep residents informed,
opportunities for public input and availability of town records.
Communications • Email/website statistics
• Percentage of qualified candidates within applicant pools
Attract, Recruit, Retain • Time to fill positions
& Develop the Highest • Percent of increased competency specific
Quality Workforce • Employee turnover rate
People, • Employee satisfaction results
Facilities, • Overtime vs. Comp time
Improve Technology,
and Facilities & Equipment • Critical infrastructure downtime
• Cost of repairs vs. replacement costs
Technologies • Projected CSS growth
Optimize Planning &
Development Capabilities • Direction Finder survey results
• Percentage of deadline compliance
27