Page 256 - City of Westlake FY20 Budget
P. 256

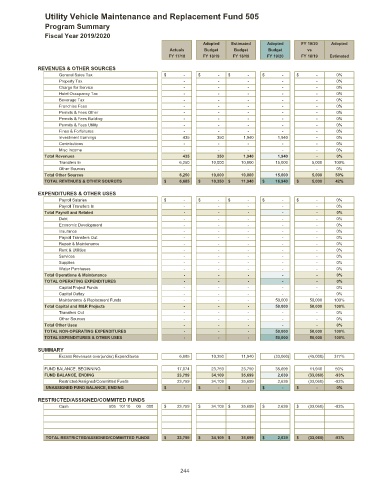
Utility Vehicle Maintenance and Replacement Fund 505

                Program Summary
                Fiscal Year 2019/2020
                                                                    Adopted   Estimated  Adopted     FY 19/20  Adopted
                                                         Actuals     Budget   Budget      Budget       vs
                                                         FY 17/18   FY 18/19  FY 18/19   FY 19/20    FY 18/19  Estimated

              REVENUES & OTHER SOURCES
                     General Sales Tax                 $                 -  $                 -  $                 -  $                 -  $                 -  0%
                     Property Tax                                         -                     -                     -                     -                     -  0%
                     Charge for Service                                   -                     -                     -                     -                     -  0%
                     Hotel Occupancy Tax                                  -                     -                     -                     -                     -  0%
                     Beverage Tax                                         -                     -                     -                     -                     -  0%
                     Franchise Fees                                       -                     -                     -                     -                     -  0%
                     Permits & Fees Other                                 -                     -                     -                     -                     -  0%
                     Permits & Fees Building                              -                     -                     -                     -                     -  0%
                     Permits & Fees Utility                               -                     -                     -                     -                     -  0%
                     Fines & Forfeitures                                  -                     -                     -                     -                     -  0%
                     Investment Earnings                                 435                    350                 1,940                 1,940                     -  0%
                     Contributions                                        -                     -                     -                     -                     -  0%
                     Misc Income                                          -                     -                     -                     -                     -  0%
                Total Revenues                                           435                    350                 1,940                 1,940                     -  0%
                     Transfers In                                     6,250               10,000               10,000               15,000                 5,000  100%
                     Other Sources                                        -                     -                     -                     -                     -  0%
                Total Other Sources                                   6,250               10,000               10,000               15,000                 5,000  50%
                TOTAL REVENUES & OTHER SOURCES         $             6,685  $           10,350  $           11,940  $           16,940  $             5,000  42%
              EXPENDITURES & OTHER USES
                     Payroll Salaries                  $                 -  $                 -  $                 -  $                 -  $                 -  0%
                     Payroll Transfers In                                 -                     -                     -                     -                     -  0%
                Total Payroll and Related                                 -                     -                     -                     -                     -  0%
                     Debt                                                 -                     -                     -                     -                     -  0%
                     Economic Development                                 -                     -                     -                     -                     -  0%
                     Insurance                                            -                     -                     -                     -                     -  0%
                     Payroll Transfers Out                                -                     -                     -                     -                     -  0%
                     Repair & Maintenance                                 -                     -                     -                     -                     -  0%
                     Rent & Utilities                                     -                     -                     -                     -                     -  0%
                     Services                                             -                     -                     -                     -                     -  0%
                     Supplies                                             -                     -                     -                     -                     -  0%
                     Water Purchases                                      -                     -                     -                     -                     -  0%
                Total Operations & Maintenance                            -                     -                     -                     -                     -  0%
                TOTAL OPERATING EXPENDITURES                              -                     -                     -                     -                     -  0%
                     Capital Project Funds                                -                     -                     -                     -                     -  0%
                     Capital Outlay                                       -                     -                     -                     -                     -  0%
                     Maintenance & Replacment Funds                       -                     -                     -               50,000               50,000  100%
                Total Capital and M&R Projects                            -                     -                     -               50,000               50,000  100%
                     Transfers Out                                        -                     -                     -                     -                     -  0%
                     Other Sources                                        -                     -                     -                     -                     -  0%
                Total Other Uses                                          -                     -                     -                     -                     -  0%
                TOTAL NON-OPERATING EXPENDITURES                          -                     -                     -               50,000               50,000  100%
                TOTAL EXPENDITURES & OTHER USES                           -                     -                     -               50,000               50,000  100%

              SUMMARY
                     Excess Revenues over(under) Expenditures                 6,685               10,350               11,940              (33,060)              (45,000)  377%

                FUND BALANCE, BEGINNING                             17,074               23,759               23,759               35,699               11,940  50%
                FUND BALANCE, ENDING                                23,759               34,109               35,699                 2,639              (33,060)  -93%
                     Restricted/Assigned/Committed Funds               23,759               34,109               35,699                 2,639              (33,060)  -93%
                UNASSIGNED FUND BALANCE, ENDING        $                 -  $                 -  $                 -  $                 -  $                 -  0%
              RESTRICTED/ASSIGNED/COMMITED FUNDS
                     Cash            505 10110  00  000  $           23,759  $           34,109  $           35,699  $             2,639  $          (33,060)  -93%


                TOTAL RESTRICTED/ASSIGNED/COMMITTED FUNDS  $           23,759  $           34,109  $           35,699  $             2,639  $          (33,060)  -93%


                                                             244
   251   252   253   254   255   256   257   258   259   260   261