Page 260 - City of Westlake FY20 Budget
P. 260

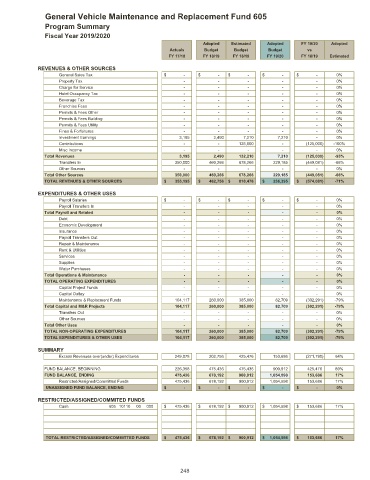
General Vehicle Maintenance and Replacement Fund 605

                Program Summary
                Fiscal Year 2019/2020
                                                                    Adopted   Estimated  Adopted     FY 19/20  Adopted
                                                         Actuals     Budget   Budget      Budget       vs
                                                         FY 17/18   FY 18/19  FY 18/19   FY 19/20    FY 18/19  Estimated

              REVENUES & OTHER SOURCES
                     General Sales Tax                 $                 -  $                 -  $                 -  $                 -  $                 -  0%
                     Property Tax                                         -                     -                     -                     -                     -  0%
                     Charge for Service                                   -                     -                     -                     -                     -  0%
                     Hotel Occupancy Tax                                  -                     -                     -                     -                     -  0%
                     Beverage Tax                                         -                     -                     -                     -                     -  0%
                     Franchise Fees                                       -                     -                     -                     -                     -  0%
                     Permits & Fees Other                                 -                     -                     -                     -                     -  0%
                     Permits & Fees Building                              -                     -                     -                     -                     -  0%
                     Permits & Fees Utility                               -                     -                     -                     -                     -  0%
                     Fines & Forfeitures                                  -                     -                     -                     -                     -  0%
                     Investment Earnings                              3,195                 2,490                 7,210                 7,210                     -  0%
                     Contributions                                        -                     -             125,000                     -            (125,000)  -100%
                     Misc Income                                          -                     -                     -                     -                     -  0%
                Total Revenues                                        3,195                 2,490             132,210                 7,210            (125,000)  -95%
                     Transfers In                                 350,000             460,266             678,266             229,185            (449,081)  -66%
                     Other Sources                                        -                     -                     -                     -                     -  0%
                Total Other Sources                               350,000             460,266             678,266             229,185            (449,081)  -66%
                TOTAL REVENUES & OTHER SOURCES         $         353,195  $         462,756  $         810,476  $         236,395  $        (574,081)  -71%
              EXPENDITURES & OTHER USES
                     Payroll Salaries                  $                 -  $                 -  $                 -  $                 -  $                 -  0%
                     Payroll Transfers In                                 -                     -                     -                     -                     -  0%
                Total Payroll and Related                                 -                     -                     -                     -                     -  0%
                     Debt                                                 -                     -                     -                     -                     -  0%
                     Economic Development                                 -                     -                     -                     -                     -  0%
                     Insurance                                            -                     -                     -                     -                     -  0%
                     Payroll Transfers Out                                -                     -                     -                     -                     -  0%
                     Repair & Maintenance                                 -                     -                     -                     -                     -  0%
                     Rent & Utilities                                     -                     -                     -                     -                     -  0%
                     Services                                             -                     -                     -                     -                     -  0%
                     Supplies                                             -                     -                     -                     -                     -  0%
                     Water Purchases                                      -                     -                     -                     -                     -  0%
                Total Operations & Maintenance                            -                     -                     -                     -                     -  0%
                TOTAL OPERATING EXPENDITURES                              -                     -                     -                     -                     -  0%
                     Capital Project Funds                                -                     -                     -                     -                     -  0%
                     Capital Outlay                                       -                     -                     -                     -                     -  0%
                     Maintenance & Replacment Funds               104,117             260,000             385,000               82,709            (302,291)  -79%
                Total Capital and M&R Projects                    104,117             260,000             385,000               82,709            (302,291)  -79%
                     Transfers Out                                        -                     -                     -                     -                     -  0%
                     Other Sources                                        -                     -                     -                     -                     -  0%
                Total Other Uses                                          -                     -                     -                     -                     -  0%
                TOTAL NON-OPERATING EXPENDITURES                  104,117             260,000             385,000               82,709            (302,291)  -79%
                TOTAL EXPENDITURES & OTHER USES                   104,117             260,000             385,000               82,709            (302,291)  -79%

              SUMMARY
                     Excess Revenues over(under) Expenditures             249,078             202,756             425,476             153,686            (271,790)  64%

                FUND BALANCE, BEGINNING                           226,358             475,436             475,436             900,912             425,476  89%
                FUND BALANCE, ENDING                              475,436             678,192             900,912          1,054,598             153,686  17%
                     Restricted/Assigned/Committed Funds             475,436             678,192             900,912          1,054,598             153,686  17%
                UNASSIGNED FUND BALANCE, ENDING        $                 -  $                 -  $                 -  $                 -  $                 -  0%
              RESTRICTED/ASSIGNED/COMMITED FUNDS
                     Cash            605 10110  00  000  $         475,436  $         678,192  $         900,912  $      1,054,598  $         153,686  17%


                TOTAL RESTRICTED/ASSIGNED/COMMITTED FUNDS  $         475,436  $         678,192  $         900,912  $      1,054,598  $         153,686  17%


                                                             248
   255   256   257   258   259   260   261   262   263   264   265