
Page 113 - City of Westlake FY20 Budget
P. 113
Section 2 Financial Analysis
Personnel Summary Overview
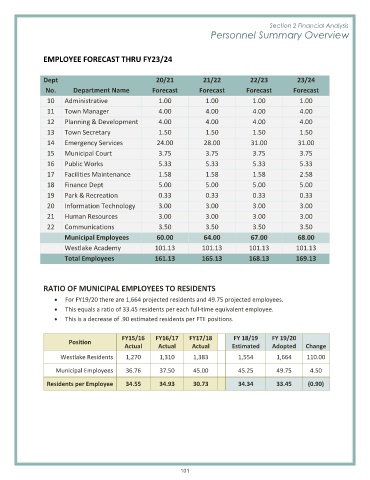
EMPLOYEE FORECAST THRU FY23/24
Dept 20/21 21/22 22/23 23/24
No. Department Name Forecast Forecast Forecast Forecast
10 Administrative 1.00 1.00 1.00 1.00
11 Town Manager 4.00 4.00 4.00 4.00
12 Planning & Development 4.00 4.00 4.00 4.00
13 Town Secretary 1.50 1.50 1.50 1.50
14 Emergency Services 24.00 28.00 31.00 31.00
15 Municipal Court 3.75 3.75 3.75 3.75
16 Public Works 5.33 5.33 5.33 5.33
17 Facilities Maintenance 1.58 1.58 1.58 2.58
18 Finance Dept 5.00 5.00 5.00 5.00
19 Park & Recreation 0.33 0.33 0.33 0.33
20 Information Technology 3.00 3.00 3.00 3.00
21 Human Resources 3.00 3.00 3.00 3.00
22 Communications 3.50 3.50 3.50 3.50
Municipal Employees 60.00 64.00 67.00 68.00
Westlake Academy 101.13 101.13 101.13 101.13
Total Employees 161.13 165.13 168.13 169.13
RATIO OF MUNICIPAL EMPLOYEES TO RESIDENTS
• For FY19/20 there are 1,664 projected residents and 49.75 projected employees.
• This equals a ratio of 33.45 residents per each full-time equivalent employee.
• This is a decrease of .90 estimated residents per FTE positions.
FY15/16 FY16/17 FY17/18 FY 18/19 FY 19/20
Position
Actual Actual Actual Estimated Adopted Change
Westlake Residents 1,270 1,310 1,383 1,554 1,664 110.00
Municipal Employees 36.76 37.50 45.00 45.25 49.75 4.50
Residents per Employee 34.55 34.93 30.73 34.34 33.45 (0.90)
101