
Page 279 - NRH FY20 Approved Budget
P. 279
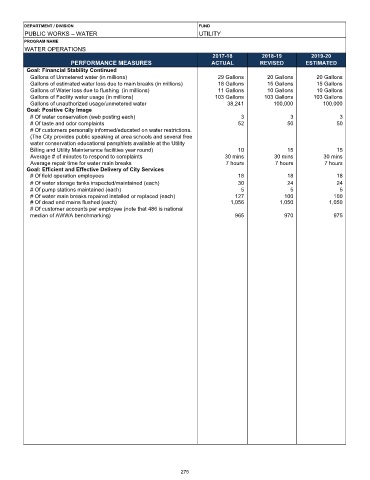
DEPARTMENT / DIVISION                                     FUND
         PUBLIC WORKS – WATER                                      UTILITY
         PROGRAM NAME
         WATER OPERATIONS
                                                                       2017-18          2018-19         2019-20
                        PERFORMANCE MEASURES                           ACTUAL          REVISED        ESTIMATED
          Goal: Financial Stability Continued
           Gallons of Unmetered water (in millions)                      29 Gallons      20 Gallons       20 Gallons
           Gallons of estimated water loss due to main breaks (in millions)  18 Gallons  15 Gallons       15 Gallons
           Gallons of Water loss due to flushing  (in millions)          11 Gallons      10 Gallons       10 Gallons
           Gallons of Facility water usage (in millions)                103 Gallons     103 Gallons      103 Gallons
           Gallons of unauthorized usage/unmetered water                    38,241          100,000         100,000
          Goal: Positive City Image
           # Of water conservation (web posting each)                            3               3               3
           # Of taste and odor complaints                                       52              50              50
           # Of customers personally informed/educated on water restrictions.
           (The City provides public speaking at area schools and several free
           water conservation educational pamphlets available at the Utility
           Billing and Utility Maintenance facilities year round)               10              15              15
           Average # of minutes to respond to complaints                   30 mins          30 mins         30 mins
           Average repair time for water main breaks                        7 hours         7 hours         7 hours
          Goal: Efficient and Effective Delivery of City Services
           # Of field operation employees                                       18              18              18
           # Of water storage tanks inspected/maintained (each)                 30              24              24
           # Of pump stations maintained (each)                                  5               5               5
           # Of water main breaks repaired installed or replaced (each)        127             100             100
           # Of dead end mains flushed (each)                                1,056            1,050           1,050
           # Of customer accounts per employee (note that 486 is national
           median of AWWA benchmarking)                                        965             970             975


                                                             275