
Page 188 - Grapevine FY20 Approved Budget
P. 188
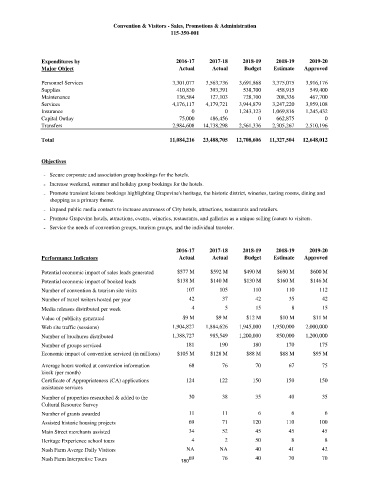
Convention & Visitors - Sales, Promotions & Administration
                                                       115-350-001


            Expenditures by                              2016-17    2017-18    2018-19    2018-19    2019-20
            Major Object                                  Actual     Actual    Budget    Estimate  Approved

            Personnel Services                          3,301,077  3,563,736  3,691,868  3,375,075  3,916,176
            Supplies                                     410,830    393,391    538,700    458,915    549,400
            Maintenance                                  136,584    127,103    728,700    208,336    467,700
            Services                                    4,176,117  4,179,721  3,944,879  3,247,220  3,959,108
            Insurance                                         0          0    1,243,123  1,069,816  1,245,432
            Capital Outlay                                75,000    486,456         0     662,875         0
            Transfers                                   2,984,608  14,738,298  2,561,336  2,305,267  2,510,196
            Total                                      11,084,216  23,488,705  12,708,606  11,327,504  12,648,012


            Objectives

             - Secure corporate and association group bookings for the hotels.
             - Increase weekend, summer and holiday group bookings for the hotels.
             - Promote transient leisure bookings highlighting Grapevine's heritage, the historic district, wineries, tasting rooms, dining and
               shopping as a primary theme.
             - Expand public media contacts to increase awareness of City hotels, attractions, restaurants and retailers.
             - Promote Grapevine hotels, attractions, events, wineries, restaurants, and galleries as a unique selling feature to visitors.
             - Service the needs of convention groups, tourism groups, and the individual traveler.


                                                         2016-17    2017-18    2018-19    2018-19    2019-20
            Performance Indicators                        Actual     Actual    Budget    Estimate  Approved

            Potential economic impact of sales leads generated   $577 M  $592 M  $490 M   $690 M     $600 M
            Potential economic impact of booked leads        $138 M  $140 M    $130 M     $160 M     $146 M
            Number of convention & tourism site visits      107        105        110        110        112
            Number of travel writers hosted per year         42         37         42         35         42
            Media releases distributed per week               4          5         15          8         15
            Value of publicity generated                   $9 M       $9 M      $12 M      $10 M      $11 M
            Web site traffic (sessions)                 1,904,827  1,884,626  1,945,000  1,950,000  2,000,000
            Number of brochures distributed             1,388,727   985,549   1,200,000   850,000   1,200,000
            Number of groups serviced                       181        190        180        170        175
            Economic impact of convention serviced (in millions)  $105 M  $128 M  $88 M    $88 M      $95 M
            Average hours worked at convention information   68         76         70         67         75
            kiosk (per month)
            Certificate of Appropriateness (CA) applications   124     122        150        150        150
            assistance services
            Number of properties researched & added to the   30         38         35         40         35
            Cultural Resource Survey
            Number of grants awarded                         11         11          6          6          6
            Assisted historic housing projects               69         71        120        110        100
            Main Street merchants assisted                   34         52         45         45         45
            Heritage Experience school tours                  4          2         50          8          8
            Nash Farm Averge Daily Visitors                 NA         NA          40         41         42
            Nash Farm Interpretive Tours                  180 69        76         40         70         70