
Page 127 - Grapevine FY20 Approved Budget
P. 127
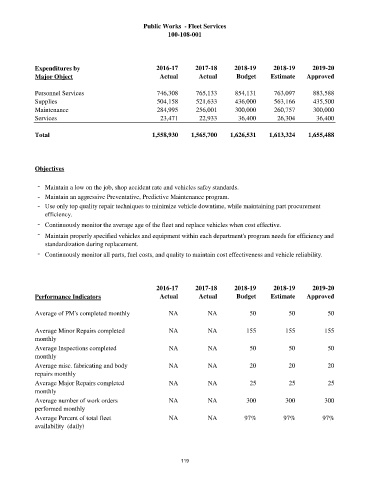
Public Works  - Fleet Services
                                                      100-108-001


          Expenditures by                         2016-17      2017-18      2018-19      2018-19      2019-20
          Major Object                             Actual       Actual       Budget     Estimate    Approved


          Personnel Services                       746,308     765,133      854,131      763,097      883,588
          Supplies                                 504,158     521,633      436,000      563,166      435,500
          Maintenance                              284,995     256,001      300,000      260,757      300,000
          Services                                  23,471       22,933      36,400       26,304       36,400

          Total                                  1,558,930    1,565,700    1,626,531    1,613,324    1,655,488


          Objectives


           - Maintain a low on the job, shop accident rate and vehicles safey standards.
           - Maintain an aggressive Preventative, Predictive Maintenance program.
           - Use only top quality repair techniques to minimize vehicle downtime, while maintaining part procurement
              efficiency.
           - Continuously monitor the average age of the fleet and replace vehicles when cost effective.
           -  Maintain properly specified vehicles and equipment within each department's program needs for efficiency and
              standardization during replacement.
           - Continuously monitor all parts, fuel costs, and quality to maintain cost effectiveness and vehicle reliability.


                                                  2016-17      2017-18      2018-19      2018-19      2019-20
          Performance Indicators                   Actual       Actual       Budget     Estimate    Approved

          Average of PM's completed monthly           NA           NA            50           50           50


          Average Minor Repairs completed             NA           NA           155          155          155
          monthly
          Average Inspections completed               NA           NA            50           50           50
          monthly
          Average misc. fabricating and body          NA           NA            20           20           20
          repairs monthly
          Average Major Repairs completed             NA           NA            25           25           25
          monthly
          Average number of work orders               NA           NA           300          300          300
          performed monthly
          Average Percent of total fleet              NA           NA           97%         97%          97%
          availability  (daily)


                                                          119