
Page 439 - City of Bedford FY20 Approved Budget
P. 439
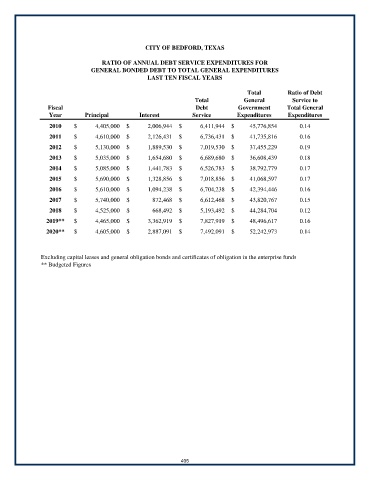
CITY OF BEDFORD, TEXAS

                                RATIO OF ANNUAL DEBT SERVICE EXPENDITURES FOR
                             GENERAL BONDED DEBT TO TOTAL GENERAL EXPENDITURES
                                               LAST TEN FISCAL YEARS

                                                                                Total         Ratio of Debt
                                                               Total           General         Service to
              Fiscal                                           Debt          Government       Total General
               Year        Principal         Interest         Service        Expenditures     Expenditures

               2010    $              4,405,000  $              2,006,944  $              6,411,944  $            45,776,854  0.14
               2011    $              4,610,000  $              2,126,431  $              6,736,431  $            41,735,816  0.16
               2012    $              5,130,000  $              1,889,530  $              7,019,530  $            37,455,229  0.19
               2013    $              5,035,000  $              1,654,680  $              6,689,680  $            36,608,439  0.18
               2014    $              5,085,000  $              1,441,783  $              6,526,783  $            38,792,779  0.17
               2015    $              5,690,000  $              1,328,856  $              7,018,856  $            41,068,597  0.17

               2016    $              5,610,000  $              1,094,238  $              6,704,238  $            42,394,446  0.16
               2017    $              5,740,000  $                 872,468  $              6,612,468  $            43,820,767  0.15
               2018    $              4,525,000  $                 668,492  $              5,193,492  $            44,284,704  0.12
              2019**   $              4,465,000  $              3,362,919  $              7,827,919  $            48,496,617  0.16
              2020**   $              4,605,000  $              2,887,091  $              7,492,091  $            52,242,973  0.14


            Excluding capital leases and general obligation bonds and certificates of obligation in the enterprise funds
            ** Budgeted Figures


                                                          405