
Page 423 - Microsoft Word - FY 2020 Adopted Budget Document
P. 423
Culture/Recreation/Education
Goal 1: Provide Activities, Educational Opportunities,
and Services that Meet the Needs of the Community
Objective 1: Develop and Implement Programming Based on the Needs of the Community
Project Performance Measure(s) City Service Team (Department)
Core Downtown Library Phase Visitor count Neighborhood Services (Library)
CRE V: First Year of Service Meeting usage
1.1.1 Technology usage
Circulation of materials at the Downtown
Library
Summary:
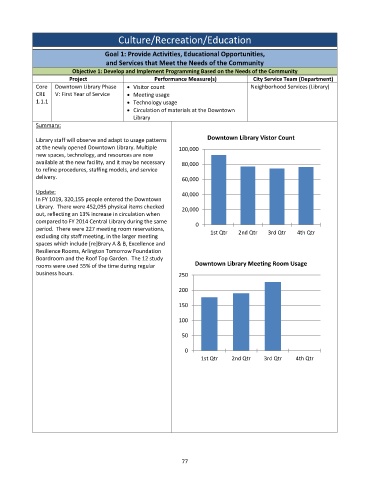
Library staff will observe and adapt to usage patterns Downtown Library Vistor Count
at the newly opened Downtown Library. Multiple 100,000
new spaces, technology, and resources are now
available at the new facility, and it may be necessary 80,000
to refine procedures, staffing models, and service
delivery. 60,000
Update: 40,000
In FY 1019, 320,155 people entered the Downtown
Library. There were 452,095 physical items checked 20,000
out, reflecting an 13% increase in circulation when
compared to FY 2014 Central Library during the same 0
period. There were 227 meeting room reservations, 1st Qtr 2nd Qtr 3rd Qtr 4th Qtr
excluding city staff meeting, in the larger meeting
spaces which include [re]Brary A & B, Excellence and
Resilience Rooms, Arlington Tomorrow Foundation
Boardroom and the Roof Top Garden. The 12 study
rooms were used 55% of the time during regular Downtown Library Meeting Room Usage
business hours. 250
200
150
100
50
0
1st Qtr 2nd Qtr 3rd Qtr 4th Qtr
77