
Page 120 - Ord 866 Adopting a revised Fiscal Year 17-18 and new proposed Fiscal Year 18-19 budget
P. 120
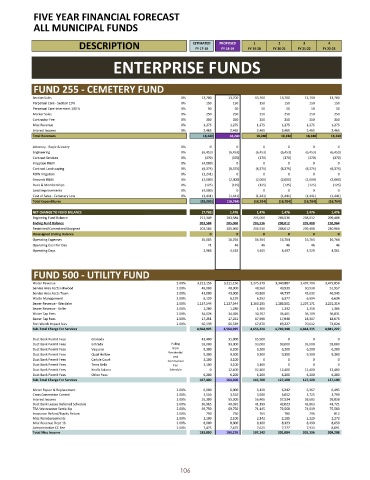
FIVE YEAR FINANCIAL FORECAST
            ALL MUNICIPAL FUNDS


                                                                 ESTIMATED  PROPOSED  1      2       3       4
                           DESCRIPTION                            FY 17- 18  FY 18- 19  FY 19- 20  FY 20- 21  FY 21- 22  FY 22- 23

                                      ENTERPRISE FUNDS


            FUND 255 - CEMETERY FUND
            Section Sales                                    0%     13, 700  13, 700  13, 700  13, 700  13, 700  13, 700
            Perpetual  Care -  Section  15%                  0%      150      150      150     150     150     150
            Perpetual  Care- interment  100 %                0%       50      50       50       50      50      50
            Marker  Sales                                    0%      250      250      250     250     250     250
            Contractor  Fee                                  0%      350      350      350     350     350     350
            Misc Revenue                                     0%     1,275    1,275    1,275   1,275   1,275    1,275
            Interest  Income                                 0%     2,465    2,465    2,465   2,465   2,465    2,465
            Total Revenues                                          18, 240  18, 240  18, 240  18, 240  18, 240  18, 240
            Attorney -  Boyle &  Lowry                       0%       0        0        0       0       0        0
            Engineering                                      0%(    6,453)(  6,453)(  6,453)(  6,453)(  6,453)(  6,453)
            Contract  Services                               0%(     370)(    370)(    370)(   370)(   370)(   370)
            Irrigation  R& M                                 0%(    4,000)     0        0       0       0        0
            Contract  Landscaping                            0%(    6,375)(  6,375)(  6,375)(  6,375)(  6,375)(  6,375)
            ROW Irrigation                                   0%(    1,241)     0        0       0       0        0
            Grounds  R& M                                    0%(    2,000)(  2,000)(  2,000)(  2,000)(  2,000)(  2,000)
            Dues &  Memberships                              0%(     125)(    125)(    125)(   125)(   125)(   125)
            Land Improvements                                0%(    4,000)     0        0       0       0        0
            Cost of Sales -  Cemetery  Lots                  0%(    1,441)(  1,441)(  1,441)(  1,441)(  1,441)(  1,441)
            Total Expenditures (                                    26, 005)(  16, 764)(  16, 764)(  16, 764)(  16, 764)(  16, 764)

            NET CHANGE  TO FUND BALANCE (                           7,765)   1,476    1,476   1,476   1,476   1,476
            Beginning  Fund Balance                                211, 349  203, 584  205, 060  206, 536  208, 012  209, 488
            Ending  Fund Balance                                   203, 584  205, 060  206, 536  208, 012  209, 488  210, 964
            Restricted/ Committed/ Assigned                        203, 584  205, 060  206, 536  208, 012  209, 488  210, 964
            Unassigned  Ending Balance                                0        0        0       0       0        0
            Operating  Expenses                                     26,005  16,764   16,764  16,764   16,764  16,764
            Operating  Cost Per Day                                   71      46       46       46      46      46
            Operating  Days                                         2,966    4,433    4,465   4,497   4,529    4,561


            FUND 500 - UTILITY FUND
            Water Revenue                                  2.00%  3,211, 156  3,211, 156  3,275, 379  3,340, 887  3,407, 704  3,475, 859
            Service  Area Accts Hillwood                   2.00%    48, 000  48, 000  48, 960  49, 939  50, 938  51, 957
            Service  Area Accts Town                       2.00%    43, 000  43, 000  43, 860  44, 737  45, 632  46, 545
            Waste Management                               2.00%    6,129    6,129    6,252   6,377   6,504    6,634
            Sewer Revenue -  Westlake                      2.00%  1,137, 544  1,137, 544  1,160, 295  1,183, 501  1,207, 171  1,231, 314
            Sewer Revenue -  Keller                        2.00%    1,280    1,280    1,306   1,332   1,358    1,386
            Water Tap Fees                                 2.00%    34, 026  34, 026  34, 707  35, 401  36, 109  36, 831
            Sewer Tap Fees                                 2.00%    17, 251  17, 251  17, 596  17, 948  18, 307  18, 673
            Fort Worth Impact fees                         2.00%    66, 539  66, 539  67, 870  69, 227  70, 612  72, 024
            Sub- Total Charge  For Services                       4,564, 925  4,564, 925  4,656, 224  4,749, 348  4,844, 335  4,941, 222
            Duct Bank Permit Fees  Granada                          43, 400  31, 000  15, 500   0       0        0
            Duct Bank Permit Fees  Entrada                Pulling   93, 000  93, 000  93, 000  93, 000  93, 000  93, 000
                                                          from
            Duct Bank Permit Fees  Vaquero                          9,300    6,200    6,200   6,200   6,200    6,200
                                                         Residential
            Duct Bank Permit Fees  Quail Hollow                     9,300    9,300    9,300   9,300   9,300    9,300
                                                          and
            Duct Bank Permit Fees  Carlyle Court                    3,100    3,100      0       0       0        0
                                                        Commerical
            Duct Bank Permit Fees  Terra Bella            Fee       3,100    3,100    3,100     0       0        0
            Duct Bank Permit Fees  Knolls Solana         Schedule     0     12, 400  12, 400  12, 400  12, 400  12, 400
            Duct Bank Permit Fees  Other Fees                       6,200    6,200    6,200   6,200   6,200    6,200
            Sub- Total Charge  For Services                        167, 400  164, 300  145, 700  127, 100  127, 100  127, 100
            Meter Repair &  Replacement                    2.00%    6,000    6,000    6,120   6,242   6,367    6,495
            Cross Connection  Control                      2.00%    3,510    3,510    3,580   3,652   3,725    3,799
            Interest  Income                               2.00%    55, 300  55, 300  56, 406  57, 534  58, 685  59, 858
            Duct Bank Leases Deferred  Schedule            2.00%    30, 965  40, 391  41, 199  42, 023  42, 863  43, 721
            TRA Wastewater  Settle- Up                     2.00%    69, 750  69, 750  71, 145  72, 568  74, 019  75, 500
            Insurance  Refund/ Equity Return               2.00%     750      750      765     780     796     812
            Misc Reimbursements                            2.00%    2,100    2,100    2,142   2,185   2,229    2,273
            Misc Revenue  Dept 16                          2.00%    8,000    8,000    8,160   8,323   8,490    8,659
            Administrative  CC Fee                         2.00%    7,475    7,475    7,625   7,777   7,933    8,091
            Total Misc Income                                      183, 850  193, 276  197, 142  201, 084  205, 106  209, 208


                                                             106