
Page 25 - 2019 Budget Detail.xlsx
P. 25
Revenue Projection: Since this budget area tends to capture some of the more
volatile and unpredictable revenue sources, it is harder to predict. We intend to leave
this budgeted number where we had it this year, which is $65,000.
Link Revenues by Month
$35,000.00
$30,000.00
$25,000.00
$20,000.00
$15,000.00
$10,000.00
$5,000.00
$‐
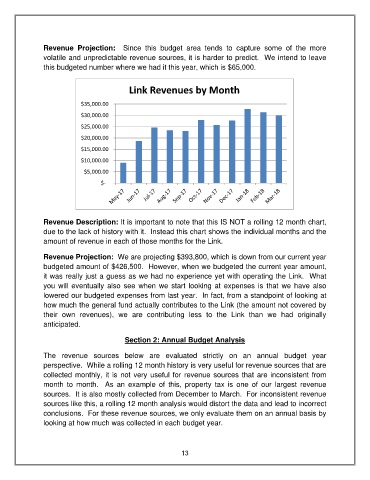
Revenue Description: It is important to note that this IS NOT a rolling 12 month chart,
due to the lack of history with it. Instead this chart shows the individual months and the
amount of revenue in each of those months for the Link.
Revenue Projection: We are projecting $393,800, which is down from our current year
budgeted amount of $426,500. However, when we budgeted the current year amount,
it was really just a guess as we had no experience yet with operating the Link. What
you will eventually also see when we start looking at expenses is that we have also
lowered our budgeted expenses from last year. In fact, from a standpoint of looking at
how much the general fund actually contributes to the Link (the amount not covered by
their own revenues), we are contributing less to the Link than we had originally
anticipated.
Section 2: Annual Budget Analysis
The revenue sources below are evaluated strictly on an annual budget year
perspective. While a rolling 12 month history is very useful for revenue sources that are
collected monthly, it is not very useful for revenue sources that are inconsistent from
month to month. As an example of this, property tax is one of our largest revenue
sources. It is also mostly collected from December to March. For inconsistent revenue
sources like this, a rolling 12 month analysis would distort the data and lead to incorrect
conclusions. For these revenue sources, we only evaluate them on an annual basis by
looking at how much was collected in each budget year.
13