
Page 40 - Cover 3.psd
P. 40
BUDGET OVERVIEW
FY 2017/2018 REVISED & FY 2018/2019 ADOPTED BUDGET
HIGHLIGHTS
As part of the regular annual budget process, some areas of the FY 2017/2018 budget
require revision from the originally adopted level. Projecting revenues and expenditures can
be difficult because they are being predicted up to fourteen months before they occur.
Revenues and expenditures are tracked throughout the year and adjustments are made to the
Adopted Budget in order to complete the fiscal year.
General Fund FY 2017/2018 Revised Budget
Revenue Overview
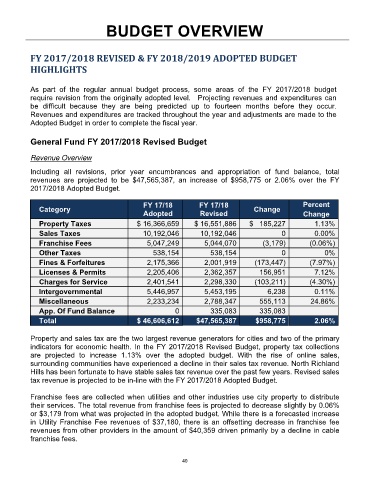
Including all revisions, prior year encumbrances and appropriation of fund balance, total
revenues are projected to be $47,565,387, an increase of $958,775 or 2.06% over the FY
2017/2018 Adopted Budget.
FY 17/18 FY 17/18 Percent
Category Change
Adopted Revised Change
Property Taxes $ 16,366,659 $ 16,551,886 $ 185,227 1.13%
Sales Taxes 10,192,046 10,192,046 0 0.00%
Franchise Fees 5,047,249 5,044,070 (3,179) (0.06%)
Other Taxes 538,154 538,154 0 0%
Fines & Forfeitures 2,175,366 2,001,919 (173,447) (7.97%)
Licenses & Permits 2,205,406 2,362,357 156,951 7.12%
Charges for Service 2,401,541 2,298,330 (103,211) (4.30%)
Intergovernmental 5,446,957 5,453,195 6,238 0.11%
Miscellaneous 2,233,234 2,788,347 555,113 24.86%
App. Of Fund Balance 0 335,083 335,083
Total $ 46,606,612 $47,565,387 $958,775 2.06%
Property and sales tax are the two largest revenue generators for cities and two of the primary
indicators for economic health. In the FY 2017/2018 Revised Budget, property tax collections
are projected to increase 1.13% over the adopted budget. With the rise of online sales,
surrounding communities have experienced a decline in their sales tax revenue. North Richland
Hills has been fortunate to have stable sales tax revenue over the past few years. Revised sales
tax revenue is projected to be in-line with the FY 2017/2018 Adopted Budget.
Franchise fees are collected when utilities and other industries use city property to distribute
their services. The total revenue from franchise fees is projected to decrease slightly by 0.06%
or $3,179 from what was projected in the adopted budget. While there is a forecasted increase
in Utility Franchise Fee revenues of $37,180, there is an offsetting decrease in franchise fee
revenues from other providers in the amount of $40,359 driven primarily by a decline in cable
franchise fees.
40