
Page 350 - Cover 3.psd
P. 350
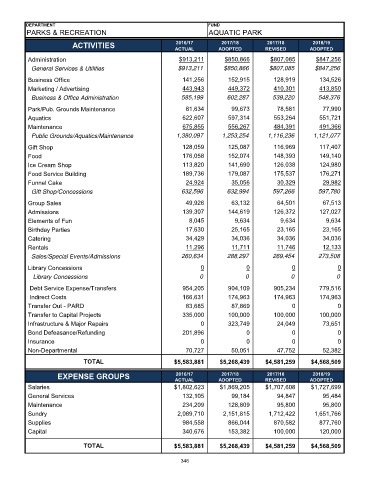
DEPARTMENT                                                  FUND
          PARKS & RECREATION                                          AQUATIC PARK
                         ACTIVITIES                        2016/17        2017/18        2017/18        2018/19
                                                           ACTUAL        ADOPTED         REVISED        ADOPTED
           Administration                                   $913,211       $850,866       $807,085        $847,256
             General Services & Utilities                   $913,211       $850,866       $807,085       $847,256

           Business Office                                   141,256        152,915         128,919        134,526
           Marketing / Advertising                           443,943        449,372         410,301        413,850
             Business & Office Administration                585,199        602,287        539,220        548,376
           Park/Pub. Grounds Maintenance                      81,634          99,673         78,581         77,990
           Aquatics                                          622,607        597,314         553,264        551,721
           Maintenance                                       675,855        556,267         484,391        491,366
             Public Grounds/Aquatics/Maintenance           1,380,097      1,253,254       1,116,236      1,121,077

           Gift Shop                                         128,059        125,087         116,969        117,407
           Food                                              176,058        152,074         148,393        149,140
           Ice Cream Shop                                    113,820        141,690         126,038        124,980
           Food Service Building                             189,736        179,087         175,537        176,271
           Funnel Cake                                        24,924          35,056         30,329         29,982
             Gift Shop/Concessions                           632,596        632,994        597,266        597,780
           Group Sales                                        49,926          63,132         64,501         67,513
           Admissions                                        139,307        144,619         126,372        127,027
           Elements of Fun                                      8,045          9,634          9,634          9,634
           Birthday Parties                                   17,630          25,165         23,165         23,165
           Catering                                           34,429          34,036         34,036         34,036
           Rentals                                            11,296          11,711         11,746         12,133
             Sales/Special Events/Admissions                 260,634        288,297        269,454        273,508
           Library Concessions                                     0               0              0              0
              Library Concessions                                  0              0              0              0

            Debt Service Expense/Transfers                   954,205        904,109         905,234        779,516
            Indirect Costs                                   166,631        174,963         174,963        174,963
           Transfer Out - PARD                                83,685          87,869              0              0
           Transfer to Capital Projects                      335,000        100,000         100,000        100,000
           Infrastructure & Major Repairs                          0        323,749          24,049         73,651
           Bond Defeasance/Refunding                         201,89 6              0              0              0
             I  n  s  u  r  a  n  c  e                             0               0              0              0
           Non-Departmental                                   70,727          50,051         47,752         52,382
                             TOTAL                         $5,583,881     $5,268,439     $4,581,259     $4,568,509

                                                                          2017/18
                                                                                         2017/18
                                                           2016/17
                                                                                                        2018/19
                    EXPENSE GROUPS                         ACTUAL        ADOPTED         REVISED        ADOPTED
           Salaries                                        $1,802,623     $1,869,205     $1,707,608     $1,727,699
           General Services                                  132,105          99,184         94,847         95,484
           Maintenance                                       234,209        128,809          95,800         95,800
           Sundry                                           2,089,710      2,151,815      1,712,422      1,651,766
           Supplies                                          984,558        866,044         870,582        877,760
           Capital                                           340,676        153,382         100,000        120,000

                             TOTAL                         $5,583,881     $5,268,439     $4,581,259     $4,568,509

                                                             346