
Page 148 - City of Arlington FY19 Adopted Operating Budget
P. 148
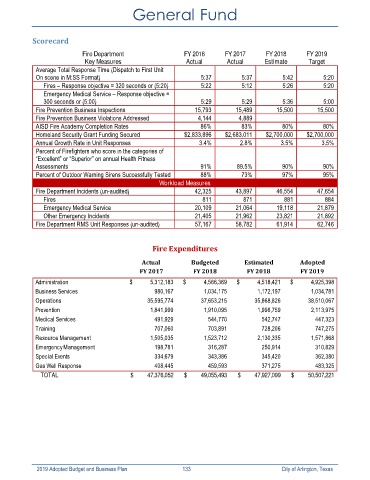
General Fund


            Scorecard
                            Fire Department                   FY 2016      FY 2017       FY 2018      FY 2019
                             Key Measures                      Actual       Actual       Estimate      Target
             Average Total Response Time (Dispatch to First Unit
             On scene in M:SS Format)                               5:37         5:37          5:42         5:20
               Fires – Response objective = 320 seconds or (5:20)   5:22         5:12         5:26          5:20
               Emergency Medical Service – Response objective =
               300 seconds or (5:00)                                5:29         5:29          5:36         5:00
             Fire Prevention Business Inspections                15,793        15,489       15,500        15,500
             Fire Prevention Business Violations Addressed         4,144        4,889
             AISD Fire Academy Completion Rates                    86%           83%          80%           80%
             Homeland Security Grant Funding Secured          $2,833,896   $2,683,011    $2,700,000   $2,700,000
             Annual Growth Rate in Unit Responses                  3.4%         2.8%          3.5%         3.5%
             Percent of Firefighters who score in the categories of
             “Excellent” or “Superior” on annual Health Fitness
             Assessments                                           91%         89.5%          90%           90%
             Percent of Outdoor Warning Sirens Successfully  Tested  88%         73%          97%           95%
                                                      Workload Measures
             Fire Department Incidents (un-audited)              42,325        43,897       46,554        47,654
               Fires                                                811           871          881           884
               Emergency Medical Service                         20,109        21,064       19,118        21,879
               Other Emergency Incidents                         21,405        21,962       23,821        21,892
             Fire Department RMS Unit Responses (un-audited)     57,167        58,782       61,914        62,746


                                                   Fire Expenditures

                                                Actual          Budgeted          Estimated         Adopted
                                               FY 2017           FY 2018           FY 2018          FY 2019
             Administration                 $                5,312,183  $                4,566,369  $                4,518,421  $                4,925,398
             Business Services                                   980,167                    1,034,175                    1,172,197                    1,034,781
             Operations                                     35,595,774                  37,653,215                  35,868,826                  38,510,067
             Prevention                                       1,841,999                    1,910,095                    1,998,759                    2,113,975
             Medical Services                                    491,929                       544,770                       542,747                       447,323
             Training                                            707,060                       703,891                       728,206                       747,275
             Resource Management                              1,505,035                    1,523,712                    2,130,335                    1,571,868
             Emergency Management                                198,781                       316,287                       250,914                       310,829
             Special Events                                      334,679                       343,386                       345,420                       362,380
             Gas Well Response                                   408,445                       459,593                       371,275                       483,325
                 TOTAL                      $             47,376,052  $             49,055,493  $             47,927,099  $             50,507,221


             2019 Adopted Budget and Business Plan                                        133                                                                  City of Arlington, Texas