
Page 146 - City of Arlington FY19 Adopted Operating Budget
P. 146
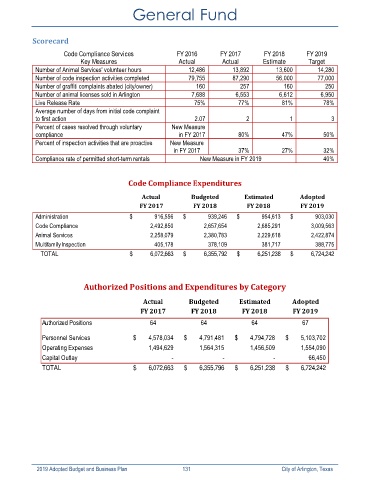
General Fund


            Scorecard
                      Code Compliance Services             FY 2016        FY 2017       FY 2018       FY 2019
                            Key Measures                    Actual         Actual       Estimate       Target
             Number of Animal Services' volunteer hours        12,486         13,892        13,600        14,280
             Number of code inspection activities completed    79,755         87,290        56,000        77,000
             Number of graffiti complaints abated (city/owner)    160           257            160           250
             Number of animal licenses sold in Arlington        7,688          6,553         6,612         6,950
             Live Release Rate                                   75%            77%           81%           78%
             Average number of days from initial code complaint
             to first action                                     2.07              2             1             3
             Percent of cases resolved through voluntary   New Measure
             compliance                                     in FY 2017          80%           47%           50%
             Percent of inspection activities that are proactive   New Measure
                                                           in FY 2017           37%           27%           32%
             Compliance rate of permitted short-term rentals       New Measure in FY 2019                   40%


                                           Code Compliance Expenditures

                                                Actual          Budgeted          Estimated         Adopted
                                               FY 2017           FY 2018           FY 2018          FY 2019
             Administration                 $                   916,556  $                   939,246  $                   954,613  $                   903,030
             Code Compliance                                  2,492,850                    2,657,654                    2,685,291                    3,009,563
             Animal Services                                  2,258,079                    2,380,783                    2,229,618                    2,422,874
             Multifamily Inspection                              405,178                       378,109                       381,717                       388,775
                 TOTAL                      $                6,072,663  $                6,355,792  $                6,251,238  $                6,724,242


                             Authorized Positions and Expenditures by Category

                                                Actual          Budgeted        Estimated         Adopted
                                               FY 2017          FY 2018          FY 2018          FY 2019

               Authorized Positions                64              64               64               67

               Personnel Services            $           4,578,034  $           4,791,481  $           4,794,728  $           5,103,702
               Operating Expenses                         1,494,629               1,564,315               1,456,509               1,554,090
               Capital Outlay                                              -                                 -                                -                     66,450
               TOTAL                         $           6,072,663  $           6,355,796  $           6,251,238  $           6,724,242


             2019 Adopted Budget and Business Plan                                        131                                                                  City of Arlington, Texas