
Page 441 - FY 19 Budget Forecast 91218.xlsx
P. 441
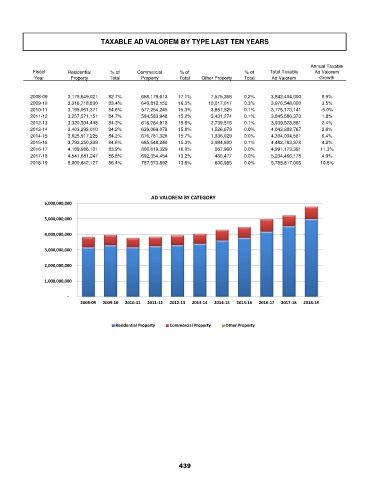
TAXABLE AD VALOREM BY TYPE LAST TEN YEARS


                                                                                                        Annual Taxable
            Fiscal     Residential    % of    Commercial     % of                 % of    Total Taxable  Ad Valorem
            Year        Property     Total      Property    Total   Other Property  Total  Ad Valorem      Growth

           2008-09         3,176,649,021  82.7%         658,179,613  17.1%         7,575,366  0.2%     3,842,404,000  8.9%
           2009-10         3,316,718,830  83.4%         649,812,152  16.3%       10,017,017  0.3%     3,976,548,000  3.5%
           2010-11         3,195,061,371  84.6%         577,254,245  15.3%         3,857,525  0.1%     3,776,173,141  -5.0%
           2011-12         3,257,571,151  84.7%         584,583,948  15.2%         3,431,274  0.1%     3,845,586,373  1.8%
           2012-13         3,320,504,448  84.3%         616,284,918  15.6%         2,739,515  0.1%     3,939,528,881  2.4%
           2013-14         3,403,293,010  84.2%         639,069,078  15.8%         1,526,679  0.0%     4,043,888,767  2.6%
           2014-15         3,625,917,225  84.2%         676,781,328  15.7%         1,336,029  0.0%     4,304,034,581  6.4%
           2015-16         3,793,250,339  84.6%         685,548,240  15.3%         3,984,800  0.1%     4,482,783,378  4.2%
           2016-17         4,189,986,101  83.9%         800,619,329  16.0%            567,960  0.0%     4,991,173,391  11.3%
           2017-18         4,541,681,247  86.8%         692,354,454  13.2%            430,477  0.0%     5,234,466,178  4.9%
           2018-19         5,000,642,127  86.4%         787,573,892  13.6%            600,985  0.0%     5,788,817,005  10.6%


                                                   AD VALOREM BY CATEGORY
                 6,000,000,000

                 5,000,000,000

                 4,000,000,000

                 3,000,000,000

                 2,000,000,000


                 1,000,000,000

                         ‐
                            2008‐09  2009‐10  2010‐11  2011‐12  2012‐13  2013‐14  2014‐15  2015‐16  2016‐17  2017‐18  2018‐19


                                       Residential Property  Commercial Property  Other Property


                                                            439