


Page 41 - CityofSouthlakeFY27Budget
P. 41
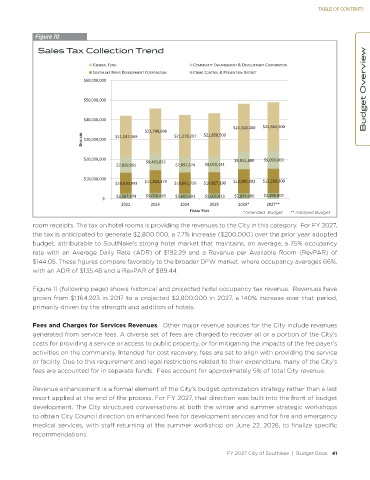
TABLE OF CONTENTS


             Figure 10

              Sales Tax Collection Trend
                                                                                                                          Budget Overview
                                ' E Z > &hE                       KDDhE/dz  E, E  D Ed Θ   s >KWD Ed  KZWKZ d/KE
                                ^Khd,> <  W Z<^   s >KWD Ed  KZWKZ d/KE   Z/D   KEdZK> Θ WZ s Ed/KE  /^dZ/ d
                             ΨϲϬ͕ϬϬϬ͕ϬϬϬ


                             ΨϱϬ͕ϬϬϬ͕ϬϬϬ


                             ΨϰϬ͕ϬϬϬ͕ϬϬϬ
                                                                              ΨϮϰ͕ϯϭϬ͕ϬϬϬ   ΨϮϰ͕ϲϲϰ͕ϱϬϬ
                                                 ΨϮϮ͕ϳϵϬ͕ϲϵϴ        ΨϮϭ͕ϴϱϬ͕ϱϬϵ
                             K>> Z^  ΨϯϬ͕ϬϬϬ͕ϬϬϬ   ΨϮϭ͕Ϭϰϳ͕ϯϲϵ   ΨϮϭ͕Ϯϳϴ͕ϮϬϳ


                             ΨϮϬ͕ϬϬϬ͕ϬϬϬ         Ψϴ͕ϰϲϯ͕ϴϯϮ                    Ψϴ͕ϵϱϱ͕ϴϬϬ   Ψϵ͕ϬϵϬ͕ϬϬϬ
                                        Ψϳ͕ϴϱϵ͕ϵϵϱ         Ψϳ͕ϴϵϳ͕ϱϳϰ   Ψϴ͕ϬϮϬ͕ϭϰϭ

                             ΨϭϬ͕ϬϬϬ͕ϬϬϬ                                                ΨϭϮ͕Ϯϲϲ͕ϯϬϬ
                                       ΨϭϬ͕ϲϭϬ͕ϵϵϯ   Ψϭϭ͕ϰϮϲ͕ϭϳϯ   ΨϭϬ͕ϲϲϭ͕ϳϮϱ   ΨϭϬ͕ϴϮϳ͕ϭϵϬ   ΨϭϮ͕Ϭϴϱ͕ϬϬϮ

                                   ΨͲ   ΨϮ͕ϱϲϳ͕ϵϳϰ   Ψϯ͕ϬϱϬ͕ϰϱϵ   ΨϮ͕ϲϬϬ͕ϲϵϭ   ΨϮ͕ϲϬϮ͕ϴϭϯ   ΨϮ͕ϴϱϰ͕ϬϬϬ   ΨϮ͕ϴϵϲ͕ϴϬϬ
                                         ϮϬϮϮ      ϮϬϮϯ      ϮϬϮϰ     ϮϬϮϱ      ϮϬϮϲΎ    ϮϬϮϳΎΎ
                                                                &/^  > z  Z      *Amended  Budget      ** Adotped Budget

            room receipts. The tax on hotel rooms is providing the revenues to the City in this category.  For FY 2027,
            the tax is anticipated to generate $2,800,000, a 7.7% increase ($200,000) over the prior year adopted
            budget, attributable to Southlake’s strong hotel market that maintains, on average, a 75% occupancy
            rate with an Average Daily Rate (ADR) of $192.29 and a Revenue per Available Room (RevPAR) of
            $144.05. These figures compare favorably to the broader DFW market, where occupancy averages 66%,
            with an ADR of $135.48 and a RevPAR of $89.44.


            Figure 11 (following page) shows historical and projected hotel occupancy tax revenue.  Revenues have
            grown from $1,164,923 in 2017 to a projected $2,800,000 in 2027, a 140% increase over that period,
            primarily driven by the strength and addition of hotels.


            Fees and Charges for Services Revenues.  Other major revenue sources for the City include revenues
            generated from service fees. A diverse set of fees are charged to recover all or a portion of the City’s
            costs for providing a service or access to public property, or for mitigating the impacts of the fee payer’s
            activities on the community. Intended for cost recovery, fees are set to align with providing the service
            or facility. Due to this requirement and legal restrictions related to their expenditure, many of the City’s
            fees are accounted for in separate funds.  Fees account for approximately 5% of total City revenue.

            Revenue enhancement is a formal element of the City’s budget optimization strategy rather than a last
            resort applied at the end of the process. For FY 2027, that direction was built into the front of budget
            development. The City structured conversations at both the winter and summer strategic workshops
            to obtain City Council direction on enhanced fees for development services and for fire and emergency
            medical services, with staff returning at the summer workshop on June 22, 2026, to finalize specific
            recommendations.


                                                                            FY 2027 City of Southlake  |  Budget Book   41

