


Page 36 - CityofSouthlakeFY27Budget
P. 36
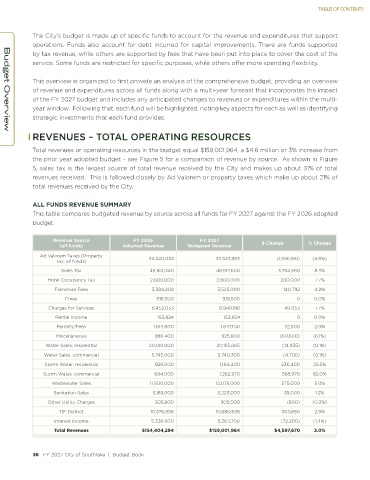
TABLE OF CONTENTS


            The City’s budget is made up of specific funds to account for the revenue and expenditures that support
            operations. Funds also account for debt incurred for capital improvements. There are funds supported
            by tax revenue, while others are supported by fees that have been put into place to cover the cost of the
            service. Some funds are restricted for specific purposes, while others offer more spending flexibility.


            This overview is organized to first provide an analysis of the comprehensive budget, providing an overview
            of revenue and expenditures across all funds along with a multi-year forecast that incorporates the impact
            of the FY 2027 budget and includes any anticipated changes to revenues or expenditures within the multi-
            year window.  Following that, each fund will be highlighted, noting key aspects for each as well as identifying
            strategic investments that each fund provides.


   Budget Overview
            REVENUES – TOTAL OPERATING RESOURCES
            Total revenues or operating resources in the budget equal $159,001,964, a $4.6 million or 3% increase from
            the prior year adopted budget – see Figure 5 for a comparison of revenue by source.  As shown in Figure
            5, sales tax is the largest source of total revenue received by the City and makes up about 31% of total
            revenues received.  This is followed closely by Ad Valorem or property taxes which make up about 21% of
            total revenues received by the City.

            ALL FUNDS REVENUE SUMMARY
            This table compares budgeted revenue by source across all funds for FY 2027 against the FY 2026 adopted
            budget.


                   Revenue Source            FY 2026               FY 2027              $ Change       % Change
                     (all funds)          Adopted Revenue      Budgeted Revenue
              Ad Valorem Taxes (Property
                    Tax, all funds)               34,920,033            33,323,883           (1,596,150)  (4.6%)
                     Sales Tax                     45,163,040           48,917,600           3,754,560   8.3%
                 Hotel Occupancy Tax               2,600,000             2,800,000            200,000    7.7%
                   Franchise Fees                  3,384,208             3,525,000             140,792   4.2%
                       Fines                         918,500               918,500                 0     0.0%
                 Charges for Services              6,452,033              6,949,186            497,153   7.7%
                   Rental Income                     153,824               153,824                 0     0.0%
                    Permits/Fees                    1,614,600             1,647,100            32,500    2.0%
                    Miscellaneous                   986,400               925,800             (60,600)   (6.1%)
                Water Sales, residential          20,140,000             20,125,065           (14,935)   (0.1%)
                Water Sales, commercial            5,745,000             5,740,300             (4,700)   (0.1%)
                Storm Water, residential            928,000               1,164,400           236,400    25.5%
               Storm Water, commercial              694,000               1,262,970           568,970    82.0%
                  Wastewater Sales                 11,500,000           12,075,000            575,000    5.0%
                   Sanitation Sales                3,185,000             3,223,000             38,000    1.2%
                 Other Utility Charges              305,800               305,000               (800)   (0.3%)
                     TIF District                  10,376,956           10,680,636            303,680    2.9%
                   Interest Income                 5,336,900             5,264,700            (72,200)   (1.4%)
                   Total Revenues               $154,404,294          $159,001,964          $4,597,670   3.0%


            36   FY 2027 City of Southlake  |  Budget Book                                                                                                                                            FY 2027 City of Southlake  |  Budget Book   37

