


Page 164 - CityofSouthlakeFY27Budget
P. 164
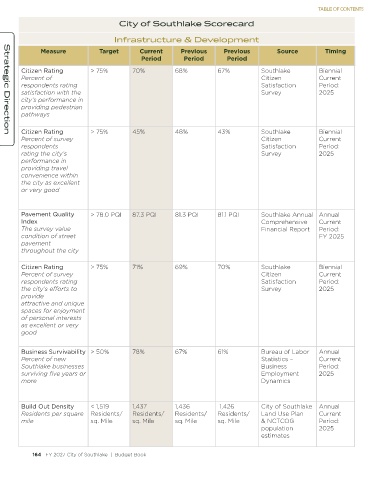
TABLE OF CONTENTS

                                        City of Southlake Scorecard

                                       Infrastructure & Development

               Measure            Target       Current       Previous      Previous          Source          Timing
                                                Period        Period        Period

        Citizen Rating         > 75%         70%           68%           67%           Southlake           Biennial
        Percent of                                                                     Citizen             Current
        respondents rating                                                             Satisfaction        Period:
        satisfaction with the                                                          Survey              2025
        city’s performance in
        providing pedestrian
        pathways

        Citizen Rating         > 75%         45%           48%           43%           Southlake           Biennial
   Strategic Direction
        Percent of survey                                                              Citizen             Current
        respondents                                                                    Satisfaction        Period:
        rating the city’s                                                              Survey              2025
        performance in
        providing travel
        convenience within
        the city as excellent
        or very good


        Pavement Quality       > 78.0 PQI    87.3 PQI      81.3 PQI      81.1 PQI      Southlake Annual  Annual
        Index                                                                          Comprehensive       Current
        The survey value                                                               Financial Report    Period:
        condition of street                                                                                FY 2025
        pavement
        throughout the city

        Citizen Rating         > 75%         71%           69%           70%           Southlake           Biennial
        Percent of survey                                                              Citizen             Current
        respondents rating                                                             Satisfaction        Period:
        the city’s efforts to                                                          Survey              2025
        provide
        attractive and unique
        spaces for enjoyment
        of personal interests
        as excellent or very
        good


        Business Survivability > 50%         78%           67%           61%           Bureau of Labor     Annual
        Percent of new                                                                 Statistics –        Current
        Southlake businesses                                                           Business            Period:
        surviving five years or                                                        Employment          2025
        more                                                                           Dynamics


        Build Out Density      < 1,519       1,437         1,436          1,426        City of Southlake  Annual
        Residents per square  Residents/     Residents/    Residents/    Residents/    Land Use Plan       Current
        mile                   sq. Mile      sq. Mile      sq. Mile      sq. Mile      & NCTCOG            Period:
                                                                                       population          2025
                                                                                       estimates


            164   FY 2027 City of Southlake  |  Budget Book                                                                                                                                          FY 2027 City of Southlake  |  Budget Book   165

