


Page 143 - CityofSouthlakeFY27Budget
P. 143
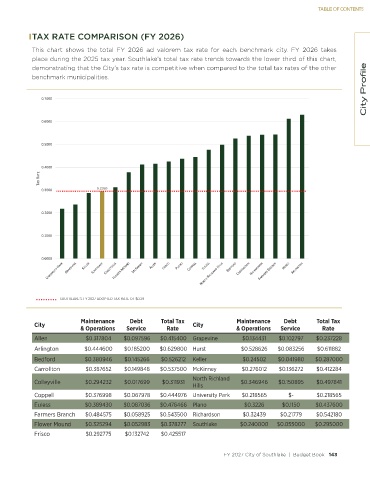
TABLE OF CONTENTS


            TAX RATE COMPARISON (FY 2026)


            This  chart  shows the  total  FY  2026 ad  valorem  tax  rate for  each  benchmark  city. FY  2026  takes
            place during the 2025 tax year. Southlake’s total tax rate trends towards the lower third of this chart,
                                                                                                                          City Profile
            demonstrating that the City’s tax rate is competitive when compared to the total tax rates of the other
            benchmark municipalities.


               Ϭ͘ϳϬϬϬ


               Ϭ͘ϲϬϬϬ


               Ϭ͘ϱϬϬϬ


               Ϭ͘ϰϬϬϬ
              d y Z d


               Ϭ͘ϯϬϬϬ            Ϭ͘ϮϵϱϬ


               Ϭ͘ϮϬϬϬ


               Ϭ͘ϭϬϬϬ


               Ϭ͘ϬϬϬϬ


                     SOUTHLAKE’S FY 2027 ADOPTED TAX RATE OF $0.29


                            Maintenance     Debt      Total Tax                Maintenance     Debt       Total Tax
            City                                                 City
                            & Operations   Service      Rate                   & Operations   Service       Rate
            Allen             $0.317804    $0.097596    $0.415400  Grapevine      $0.134431    $0.102797    $0.237228
            Arlington        $0.444600     $0.185200    $0.629800  Hurst         $0.528626    $0.083256    $0.611882
            Bedford           $0.380946    $0.145266    $0.526212  Keller         $0.24502    $0.041980    $0.287000
            Carrollton        $0.387652    $0.149848    $0.537500  McKinney       $0.276012    $0.136272    $0.412284
                                                                 North Richland
            Colleyville       $0.294232    $0.017699    $0.311931                $0.346946    $0.150895    $0.497841
                                                                 Hills
            Coppell           $0.376998    $0.067978    $0.444976  University Park   $0.218565   $-       $0.218565
            Euless            $0.389430    $0.087036    $0.476466  Plano          $0.3226      $0.1150    $0.437600
            Farmers Branch    $0.484575    $0.058925    $0.543500  Richardson     $0.32439    $0.21779    $0.542180
            Flower Mound      $0.325294    $0.052983    $0.378277  Southlake     $0.240000    $0.055000    $0.295000
            Frisco            $0.292775    $0.132742    $0.425517


                                                                           FY 2027 City of Southlake  |  Budget Book   143

