


Page 142 - CityofSouthlakeFY27Budget
P. 142
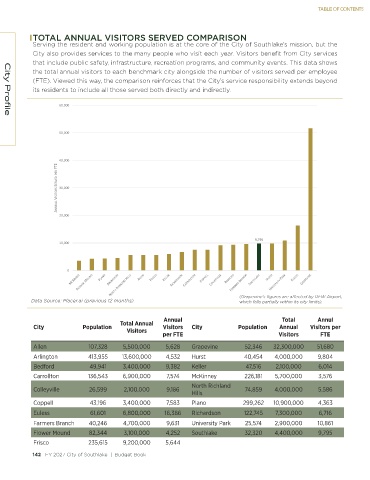
TABLE OF CONTENTS


            TOTAL ANNUAL VISITORS SERVED COMPARISON
            Serving the resident and working population is at the core of the City of Southlake’s mission, but the
            City also provides services to the many people who visit each year. Visitors benefit from City services
            that include public safety, infrastructure, recreation programs, and community events. This data shows
            the total annual visitors to each benchmark city alongside the number of visitors served per employee
            (FTE). Viewed this way, the comparison reinforces that the City’s service responsibility extends beyond
            its residents to include all those served both directly and indirectly.

                     ϲϬ͕ϬϬϬ

   City Profile

                     ϱϬ͕ϬϬϬ


                     ϰϬ͕ϬϬϬ
                     EEh > s/^/dKZ^ ^ Zs   W Z &d   ϯϬ͕ϬϬϬ


                     ϮϬ͕ϬϬϬ


                                                                                     ϵ͕ϳϵϱ
                     ϭϬ͕ϬϬϬ


                       Ϭ


                                                                                (Grapevine’s figures are affected by DFW Airport,
           Data Source: Placer.ai (previous 12 months)                          which falls partially within its city limits).

                                                       Annual                                 Total       Annul
                                         Total Annual
            City            Population                 Visitors   City          Population   Annual     Visitors per
                                           Visitors
                                                       per FTE                               Visitors      FTE
            Allen              107,328    5,500,000     5,628   Grapevine         52,346   32,300,000     51,680
            Arlington          413,955   13,600,000     4,532   Hurst             40,454    4,000,000     9,804
            Bedford            49,941     3,400,000     9,382   Keller             47,516   2,100,000     6,014
            Carrollton         136,543    6,900,000     7,574   McKinney          226,181   5,700,000     3,576
                                                                North Richland
            Colleyville        26,599     2,100,000     9,186                      74,859   4,000,000     5,586
                                                                Hills
            Coppell            43,196     3,400,000     7,583   Plano             299,262   10,900,000    4,363
            Euless             61,601     6,800,000     16,386  Richardson        122,745   7,300,000     6,716
            Farmers Branch     40,246     4,700,000     9,631   University Park    25,574   2,900,000     10,861
            Flower Mound       82,344     3,100,000     4,252   Southlake         32,320    4,400,000     9,795
            Frisco             235,615    9,200,000     5,644

            142   FY 2027 City of Southlake  |  Budget Book                                                                                                                                          FY 2027 City of Southlake  |  Budget Book   143

