


Page 141 - CityofSouthlakeFY27Budget
P. 141
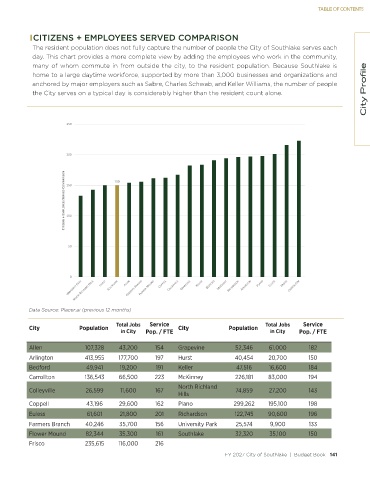
TABLE OF CONTENTS


            CITIZENS + EMPLOYEES SERVED COMPARISON
            The resident population does not fully capture the number of people the City of Southlake serves each
            day. This chart provides a more complete view by adding the employees who work in the community,
            many of whom commute in from outside the city, to the resident population. Because Southlake is
                                                                                                                          City Profile
            home to a large daytime workforce, supported by more than 3,000 businesses and organizations and
            anchored by major employers such as Sabre, Charles Schwab, and Keller Williams, the number of people
            the City serves on a typical day is considerably higher than the resident count alone.


                       ϮϱϬ


                       ϮϬϬ


                       /d/ E^ н  DW>Kz  ^ ^ Zs    KDW Z/^KE  ϭϱϬ  ϭϱϬ


                       ϭϬϬ


                        ϱϬ


                        Ϭ


           Data Source: Placer.ai (previous 12 months)

                                       Total Jobs   Service                              Total Jobs   Service
           City            Population                       City             Population
                                         in City  Pop. / FTE                              in City   Pop. / FTE

           Allen              107,328   43,200      154     Grapevine          52,346     61,000       182
           Arlington          413,955   177,700     197     Hurst              40,454     20,700       150
           Bedford            49,941     19,200      191    Keller              47,516    16,600       184
           Carrollton         136,543   66,500      223     McKinney           226,181    83,000       194
                                                            North Richland
           Colleyville        26,599     11,600     167                        74,859     27,200       143
                                                            Hills
           Coppell            43,196    29,600      162     Plano              299,262    195,100      198

           Euless             61,601     21,800     201     Richardson         122,745    90,600       196
           Farmers Branch     40,246     35,700     156     University Park    25,574     9,900        133
           Flower Mound       82,344    35,300       161    Southlake          32,320     35,100       150
           Frisco             235,615   116,000     216
                                                                           FY 2027 City of Southlake  |  Budget Book   141

