


Page 147 - CityofSouthlakeFY27Budget
P. 147
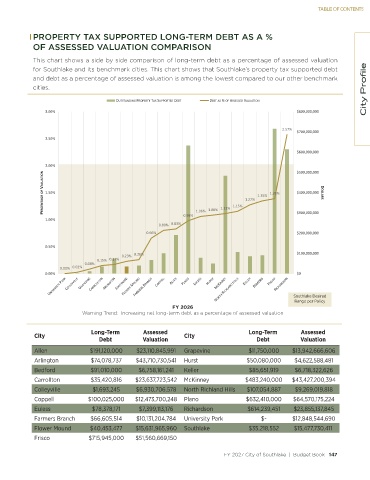
TABLE OF CONTENTS


            PROPERTY TAX SUPPORTED LONG-TERM DEBT AS A %
            OF ASSESSED VALUATION COMPARISON

            This chart shows a side by side comparison of long-term debt as a percentage of assessed valuation
            for Southlake and its benchmark cities. This chart shows that Southlake’s property tax supported debt
            and debt as a percentage of assessed valuation is among the lowest compared to our other benchmark
            cities.                                                                                                       City Profile

                                       Khd^d E /E' WZKW Zdz d y ^hWWKZd      d     d  ^ й K&  ^^ ^^   s >h d/KE
                ϯ͘ϬϬй                                                                              ΨϴϬϬ͕ϬϬϬ͕ϬϬϬ


                                                                                              Ϯ͘ϱϳй
                                                                                                   ΨϳϬϬ͕ϬϬϬ͕ϬϬϬ
                Ϯ͘ϱϬй

                                                                                                   ΨϲϬϬ͕ϬϬϬ͕ϬϬϬ

                Ϯ͘ϬϬй                                                                              ΨϱϬϬ͕ϬϬϬ͕ϬϬϬ
               W Z  Ed '  K& s >h d/KE  ϭ͘ϱϬй                                 ϭ͘ϭϱй  ϭ͘Ϯϳй  ϭ͘ϯϱй  ϭ͘ϯϵй  ΨϰϬϬ͕ϬϬϬ͕ϬϬϬ   K>> Z^


                ϭ͘ϬϬй                                         Ϭ͘ϵϴй  ϭ͘Ϭϲй  ϭ͘Ϭϴй  ϭ͘ϭϭй           ΨϯϬϬ͕ϬϬϬ͕ϬϬϬ
                                                      Ϭ͘ϴϬй  Ϭ͘ϴϯй
                                                 Ϭ͘ϲϲй                                             ΨϮϬϬ͕ϬϬϬ͕ϬϬϬ

                Ϭ͘ϱϬй
                                         Ϭ͘Ϯϯй  Ϭ͘Ϯϲй                                              ΨϭϬϬ͕ϬϬϬ͕ϬϬϬ
                                 Ϭ͘ϭϱй Ϭ͘ϭϳй
                             Ϭ͘Ϭϴй
                     Ϭ͘ϬϬй  Ϭ͘ϬϮй
                Ϭ͘ϬϬй                                                                              ΨϬ


                                                                                                  Southlake Desired
                                                                                                  Range per Policy
                                                          FY 2026
                            Warning Trend:  Increasing net long-term debt as a percentage of assessed valuation


                               Long-Term        Assessed                           Long-Term         Assessed
            City                                              City
                                  Debt          Valuation                             Debt          Valuation
            Allen              $191,120,000    $23,110,845,991   Grapevine          $11,750,000    $13,942,666,606
            Arlington           $74,078,737    $43,710,730,541  Hurst              $50,080,000     $4,622,588,481
            Bedford            $91,010,000     $6,758,161,241   Keller              $85,651,919    $6,718,322,626
            Carrollton          $35,420,816    $23,637,723,542  McKinney           $483,240,000    $43,427,200,394
            Colleyville         $1,693,245     $6,930,706,578   North Richland Hills   $107,054,887    $9,269,019,818
            Coppell            $100,025,000    $12,473,700,248  Plano              $632,410,000    $64,570,175,224
            Euless              $78,378,171    $7,399,113,176   Richardson         $614,239,451    $23,855,137,845
            Farmers Branch     $66,605,514     $10,131,204,784   University Park        $-        $12,848,544,690
            Flower Mound       $40,453,477    $15,631,965,960  Southlake            $35,218,552   $15,477,730,411
            Frisco             $715,945,000    $51,560,669,150

                                                                           FY 2027 City of Southlake  |  Budget Book   147

