
Page 51 - CITY OF WATAUGA, TEXAS ANNUAL BUDGET PORTRAIT
P. 51
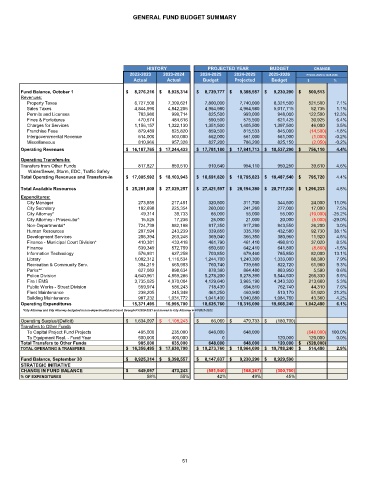
GENERAL FUND BUDGET SUMMARY


                                              HISTORY             PROJECTED YEAR       BUDGET        CHANGE
                                        2022-2023  2023-2024    2024-2025  2024-2025  2025-2026    FY2024-2025 to 2025-2026
                                          Actual     Actual      Budget    Projected   Budget      $                            %

    Fund Balance, October 1            $       8,276,216  $       8,925,314  $      8,729,777  $        9,398,557  $       9,230,290  $        500,513
    Revenues:
         Property Taxes                   6,727,508  7,309,621   7,800,000   7,740,000  8,321,500  521,500   7.1%
         Sales Taxes                      4,844,990  4,842,205   4,964,980   4,964,980  5,017,715   52,735   1.1%
         Permits and Licenses              783,980    999,714     825,500     993,000    948,000   122,500  12.3%
         Fines & Forfeitures               470,674    484,616     590,500     575,500    621,425    30,925   6.4%
         Charges for Services             1,156,157  1,322,130   1,351,500   1,405,500  1,397,500   46,000   3.5%
         Franchise Fees                    879,489    825,820     859,500     815,533    845,000    (14,500)  -1.8%
         Intergovernmental Revenue         514,000    503,000     562,000     561,000    561,000     (1,000)  -0.2%
         Miscellaneous                     810,966    957,328     827,200     786,200    825,150     (2,050)  -0.2%
    Operating Revenues                 $     16,187,765  $     17,244,433  $    17,781,180  $      17,841,713  $     18,537,290  $        756,110  4.4%
    Operating Transfers-In:
    Transfers from Other Funds             817,827    859,510     910,640     954,110    950,250    39,610   4.6%
          Water/Sewer, Storm, EDC, Traffic Safety
    Total Operating Revenues and Transfers-in  $     17,005,592  $     18,103,943  $    18,691,820  $      18,795,823  $     19,487,540  $        795,720  4.4%

    Total Available Resources          $     25,281,808  $     27,029,257  $    27,421,597  $      28,194,380  $     28,717,830  $     1,296,233  4.8%
    Expenditures:
         City Manager                      273,559    217,451     320,500     311,700    344,500    24,000  11.0%
         City Secretary                    182,698    225,354     260,000     241,260    277,000    17,000   7.5%
         City Attorney*                     49,314     39,733      65,000      55,000     55,000    (10,000)  -25.2%
         City Attorney - Prosecutor*        15,525     17,236      25,000      21,000     20,000     (5,000)  -29.0%
         Non-Departmental*                 724,739    882,188     917,350     917,290    943,550    26,200   3.0%
         Human Resources                   207,594    243,239     339,850     335,760    432,580    92,730  38.1%
         Development Services              206,394    263,248     369,040     366,350    380,960    11,920   4.5%
         Finance - Municipal Court Division*  410,381  433,418    461,790     461,410    498,810    37,020   8.5%
         Finance                           539,349    572,759     650,660     642,410    641,800     (8,860)  -1.5%
         Information Technology            576,931    627,258     703,850     679,460    785,850    82,000  13.1%
         Library                          1,002,312  1,116,534   1,244,700   1,240,300  1,333,000   88,300   7.9%
         Recreation & Community Serv.      394,219    665,993     760,740     739,660    822,720    61,980   9.3%
         Parks**                           627,082    898,634     878,360     864,480    883,950     5,590   0.6%
         Police Division                  4,640,961  4,859,286   5,278,200   5,278,390  5,544,530   266,330  5.5%
         Fire / EMS                       3,735,025  4,070,004   4,129,640   3,965,190  4,343,320   213,680  5.3%
         Public Works - Street Division    559,974    586,243     718,430     694,810    762,740    44,310   7.6%
         Fleet Maintenance                 238,205    245,348     461,250     460,940    513,170    51,920  21.2%
         Building Maintenance              987,232   1,031,772   1,041,400   1,040,680  1,084,760   43,360   4.2%
    Operating Expenditures               15,371,495  16,995,700  18,625,760  18,316,090  19,668,240  1,042,480  6.1%
       *City Attorney and City Attorney budgeted in non-departmental and Court through FY2020-2021 and moved to City Attorney in FY2021-2022
    Operating Surplus/(Deficit)        $       1,634,097  $       1,108,243  $           66,060  $           479,733  $         (180,700)
    Transfers to Other Funds
         To Capital Project Fund Projects  485,000    235,000     648,000     648,000              (648,000)  100.0%
         To Equipment Repl. - Fund Year    500,000    400,000          0                 120,000   120,000   0.0%

    Total Transfers to Other Funds         985,000    635,000     648,000     648,000    120,000  $      (528,000)
    TOTAL OPERATING & TRANSFERS        $     16,356,495  $     17,630,700  $    19,273,760  $      18,964,090  $     19,788,240  $        514,480  2.9%
    Fund Balance, September 30         $       8,925,314  $       9,398,557  $      8,147,837  $        9,230,290  $       8,929,590
    STRATEGIC INITIATIVE
    CHANGE IN FUND BALANCE             $          649,097  473,243  (581,940)  (168,267)  (300,700)
    % OF EXPENDITURES                         58%        55%         42%         49%        45%


                                                          51