
Page 491 - Bedford-FY25-26 Budget
P. 491
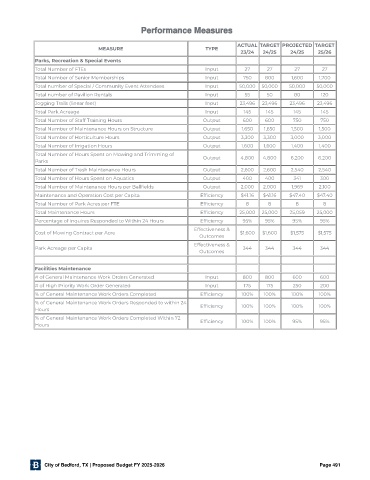
Performance Measures


                                                                                ACTUAL  TARGET  PROJECTED  TARGET
                                  MEASURE                            TYPE
                                                                                 23/24  24/25    24/25    25/26

             Parks, Recreation & Special Events
             Total Number of FTEs                                    Input        27     27       27        27
             Total Number of Senior Memberships                      Input       750     800     1,600     1,700
             Total number of Special / Community Event Attendees     Input      50,000  50,000   50,000   50,000
             Total number of Pavilion Rentals                        Input        55     50       80       120
             Jogging Trails (linear feet)                            Input      23,496  23,496   23,496   23,496
             Total Park Acreage                                      Input        145    145      145      145
             Total Number of Staff Training Hours                   Output       600     600      750      750
             Total Number of Maintenance Hours on Structure         Output       1,650  1,650    1,500     1,500
             Total Number of Horticulture Hours                     Output       3,300  3,300    3,000    3,000
             Total Number of Irrigation Hours                       Output       1,600  1,600    1,400    1,400
             Total Number of Hours Spent on Mowing and Trimming of  Output       4,800  4,800    6,200    6,200
             Parks
             Total Number of Trash Maintenance Hours                Output       2,600  2,600    2,540    2,540
             Total Number of Hours Spent on Aquatics                Output       400     400      341      300
             Total Number of Maintenance Hours per Ball elds        Output       2,000  2,000    1,969     2,100
             Maintenance and Operation Cost per Capita             Ef ciency     $41.16  $41.16  $47.40   $47.40
             Total Number of Park Acres per FTE                    Ef ciency      8       8        8        8
             Total Maintenance Hours                               Ef ciency    25,000  25,000   25,059   25,000
             Percentage of Inquires Responded to Within 24 Hours   Ef ciency     95%     95%      95%      95%
                                                                 Effectiveness &
             Cost of Mowing Contract per Acre                                   $1,600  $1,600   $1,575   $1,575
                                                                   Outcomes
                                                                 Effectiveness &
             Park Acreage per Capita                                             344     344      344      344
                                                                   Outcomes


             Facilities Maintenance
             # of General Maintenance Work Orders Generated          Input       800     800      600      600
             # of High Priority Work Order Generated                 Input        175    175      250      200
             % of General Maintenance Work Orders Completed        Ef ciency     100%   100%     100%     100%
             % of General Maintenance Work Orders Responded to within 24  Ef ciency  100%  100%  100%     100%
             Hours
             % of General Maintenance Work Orders Completed Within 72  Ef ciency  100%  100%      95%      95%
             Hours


                City of Bedford, TX | Proposed Budget FY 2025-2026                                         Page 491