
Page 361 - CityofArlingtonFY26AdoptedBudget
P. 361
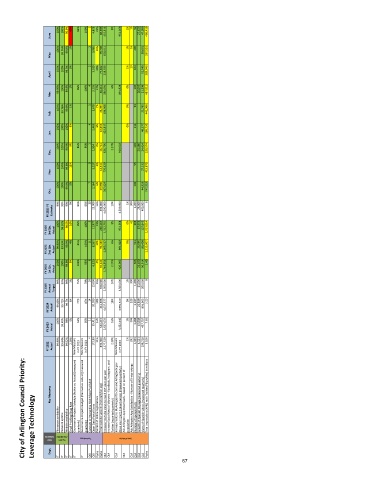
100%  100%  95.9%  40%  85%  100%  1  4,823  21%  88,586  415,816  9%  951,268  1%  13  92  27,656  47,099  486,419
                  June

                    100%  99.76%  99.9%  5%  2  3,965  10%  79,708  658,011  1%  16  400  58,001  337,552
                  May

                    100%  100%  99.9%  3%  2  3,189  20%  77,822  238,928  1%  13  104  52,545  389,043
                  April

                    99.95%  100%  99.9%  1%  85%  100%  4  3,126  17%  46,411  386,694  6%  891,828  0%  106  26,095  21,236  487,811
                  Mar.

                    100%  99.78%  99.8%  1%  3  2,678  7%  23,495  194,006  0%  94  21,795  441,366
                  Feb.

                    100%  100%  100%  9%  4  2,463  6%  22,654  422,817  0%  111  46,377  286,730
                  Jan.

                    100%  100%  99.9%  9%  85%  95%  1  1,934  3%  16,711  626,705  2.27%  920,002  103  24,180  24,454  230,574
                  Dec.

                    100%  100%  99.8%  12%  0  2,127  4%  14,541  770,420  95  27,132  415,873
                  Nov.

                    100%  100%  99.9%  5%  7  2,164  6%  23,990  347,429  108  44,928  747,319
                  Oct.

                 FY 2025 YE  Estimate  99%  99%  99%  5%  85%  85%  30                 22,000   15%  450,000  4,000,000  10%  3,500,000  1%  300  1,200  28,000  400,000  6


                    100%  99.92%  98.5%  16%  85%  100%  5   19%  246,116  1,312,755  9%  951,268  0%  42  296  27,656  157,645  1,213,014
                FY 2025  3rd Qtr.  Actual                11,977

                FY 2025  2nd Qtr.  Actual  99.98%  99.93%  99.9%  4%  85%  100%  11  8,267  10%  92,560  1,003,517  6%  891,828  0%  311  26,095  89,408  1,215,907


                    100%  100%  99.9%  9%  100%  95%  8   4%  55,242  1,744,554  2.27%  920,002  306  24,180  96,514  1.40
                FY 2025  1st Qtr.  Actual                  6,225

                    99%  99%  99%  3%  75%  78%  20   15%  10%  1%  300  1,200  25,000  200,000  8
                FY 2025   Annual   Target                15,000   550,000  2,000,000  3,500,000

                    99.88%  99.71%  99.7%  6%  77%  87%  14  20,039  10%  411,926  4,637,377  18%  3,991,350  0%  329  1,197  22,849  804,903  5.25
                 FY 2024  Actual

                    100%  99.40%  99%  5%  53%  85%  11   15%  544,215  16%  1%  306  1,168  13,608  457,757  7.65
                 FY 2023  Actual                35,411   2,637,078          3,452,446

                    99.98%  99.84%  99.52%  2.38%  4   11%  632,300  2,177,529  2.38%  1%  242  1,503  4,521  198,218  5.106
                 FY 2022  Actual  New Measure   in FY 2023  New Measure   in FY 2023                17,199   New Measure   in FY 2023

         City of Arlington Council Priority:  Leverage Technology  Key Measures  File server availability  Network uptime  Website availability   Email Phishing/Snag Rate Governance Projects Schedule (Active vs. Actual) [measured   quarterly] Governance Projects Budget (Planned vs. Actual) [measured   quarterly] Datasets or Interactive Web Maps Published Open Data Portal Users Percent of online registrations Total website sessions (naturallyfun.org) Increase YouTube views to reach 2M


                   Category
                       Availability
                                             Social Media
                               Technology
                       System
                  Goal
                  Dept.
                                   Parks
                                  Parks
                                                  Parks
                                        CLA
                                          CLA
                                    CLA
                                     CLA
                                              CLA
                                               CLA
                                                 CLA
                                             CLA
                                OSI
                               OSI
                       IT
                      IT
                    IT
                             IT
                          IT
                         IT
                                                             67