Page 118 - CityofWataugaAdoptedBudgetFY25
P. 118

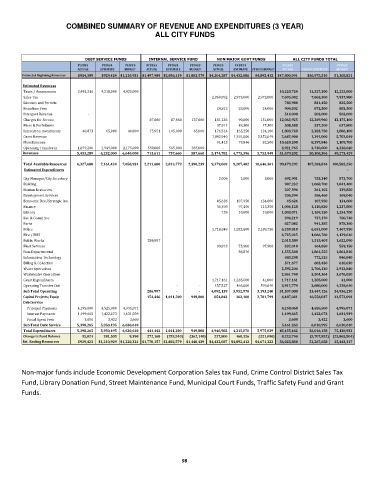
COMBINED SUMMARY OF REVENUE AND EXPENDITURES (3 YEAR)
                                                    ALL CITY FUNDS


                             DEBT SERVICE FUNDS   INTERNAL SERVICE FUND   NON MAJOR GOVT FUNDS    ALL CITY FUNDS TOTAL
                           FY2023          FY2024      FY2025   FY2023          FY2024      FY2025   FY2023          FY2024      FY2023       FY2025
                           ACTUAL  ESTIMATE  BUDGET  ACTUAL  ESTIMATE  BUDGET  ACTUAL  ESTIMATE  FY2025 BUDGET  ACTUAL  FY2024 ESTIMATE  BUDGET
        Estimated Beginning Resources  $914,399  $929,424 $1,210,931 $1,497,989 $2,056,119  $1,802,579  $4,204,287 $4,432,086  $4,892,412  $47,800,091  $56,975,510      51,308,821
        Estimated Revenues
         Taxes / Assessments          3,493,216        4,218,000     4,425,000                  10,220,724           11,527,300      12,225,000
         Sales Tax                                                         2,850,052      2,973,000        2,973,000        7,695,042             7,863,300        7,937,980
         Licenses and Permits                                                                         783,980                 831,450           825,500
         Franchise Fees                                                         24,813           28,000             24,000           904,302                 873,500           883,500
         Intergovt Revenue                     -                 -                 -                  514,000                 503,000           562,000
         Charges for Service                             87,660          87,660          137,660          151,136           90,000           151,000     12,063,925           12,269,960      13,175,160
         Fines & Forfeitures                                                    37,914           48,300             47,300           508,588                 537,200           637,800
         Interest on Investments               40,873             65,000           40,000           75,951        105,000            65,000          176,514         165,250           124,100        1,803,728             2,383,750        1,886,100
         Grant Revenue                                                     1,842,940      1,391,000        2,352,049        2,642,940             1,391,000        5,702,049
         Miscellaneous                                                          91,413           79,846             82,500     10,620,208             8,397,846        1,109,700
         Operating Transfer In          1,879,200        1,949,000     2,175,000         550,000        565,000          385,000                   -        3,921,765             3,730,000        4,328,640
         Total Current Year
        Revenues               5,413,289       6,232,000    6,640,000        713,611       757,660         587,660      5,174,782     4,775,396       5,753,949     51,679,202           50,308,306      49,273,429
                                                                                       -                                         -
         Total Available Resources         6,327,688       7,161,424    7,850,931     2,211,600    2,813,779      2,390,239      9,379,069     9,207,482     10,646,361     99,479,292         107,283,816  100,582,250

         Estimated Expenditures                                                                                                  -
         City Manager/City Secretary                                               2,006             1,000                5,000           692,901                 753,340           873,700
         Building                                                                                     987,232             1,068,700        1,041,400
         Human Resources                                                                              207,594                 261,102           339,850
         Development Services                                                                         206,394                 286,460           369,040
         Economic Dev./Strategic Inn.                                           45,626         107,950           134,600             45,626                 107,950           134,600
         Finance                                                                56,398           97,450           115,350        1,006,128             1,110,830        1,227,800
         Library                                                                      759           10,000             10,000        1,003,071             1,169,150        1,254,700
         Rec & Comm Svc                                                                               394,219                 737,170           760,740
         Parks                                                                                        627,082                 941,385           878,360
         Police                                                            1,718,849      1,822,800        2,189,750        6,359,810             6,651,000        7,467,950
         Fire / EMS                                                                                3,735,025             4,066,760        4,129,640
         Public Works                                  286,997                                     2,015,589             1,515,405        1,622,090
         Fleet Services                                                         93,813           75,900             97,900           332,018                 364,850           559,150
         Non-Departmental                                                              86,870        1,555,540             1,861,555        1,861,810
         Information Technology                                                                       683,298                 772,525           846,840
         Billing & Collection                                                                         571,677                 603,450           610,030
         Water Operations                                                                          2,592,204             2,706,130        2,912,840
         Wastewater Operations                                                                     2,861,740             3,504,364        3,676,050
         Grant Expenditures                                                1,717,161      1,285,000             41,000        1,717,161             1,285,000              41,000
         Operating Transfer Out                                        -                  -          457,527         466,000           599,640        3,912,779             3,680,000        4,328,640
         Sub Total Operating                          286,997                -                  -      4,092,139     3,952,970       3,193,240     31,507,088           33,447,126      34,936,230
         Capital Projects/Equip                       154,446    1,011,200         949,800         854,843        362,100       2,781,799        6,487,041           16,558,037      33,572,093
         Debt Service
             Principal Payments          4,195,000        4,525,000     4,995,071                  4,258,068             4,585,500        4,995,071
             Interest Payments          1,199,665        1,422,073     1,631,939                   1,199,665             1,422,073        1,631,939
             Fiscal Agent Fees                 3,600               3,422             3,600                3,600                     3,422                3,600
         Sub Total Debt Service         5,398,265       5,950,495    6,630,610                     5,461,333             6,010,995        6,630,610
         Total Expenditures         5,398,265       5,950,495    6,630,610        441,443    1,011,200         949,800      4,946,982     4,315,070       5,975,039     43,455,462           56,016,158      75,138,933
         Change in Fund Balance              15,024          281,505            9,390        272,168      (253,540)      (362,140)        227,800        460,326         (221,090)       8,223,740            (5,707,852)   (25,865,504)
        Est. Ending Resources  $929,423  $1,210,929 $1,220,321 $1,770,157 $1,802,579  $1,440,439  $4,432,087 $4,892,412  $4,671,322     56,023,830           51,267,658      25,443,317


        Non-major funds include Economic Development Corporation Sales tax Fund, Crime Control District Sales Tax
        Fund, Library Donation Fund, Street Maintenance Fund, Municipal Court Funds, Traffic Safety Fund and Grant
        Funds.


                                                             98
   113   114   115   116   117   118   119   120   121   122   123