
Page 117 - CityofWataugaAdoptedBudgetFY25
P. 117
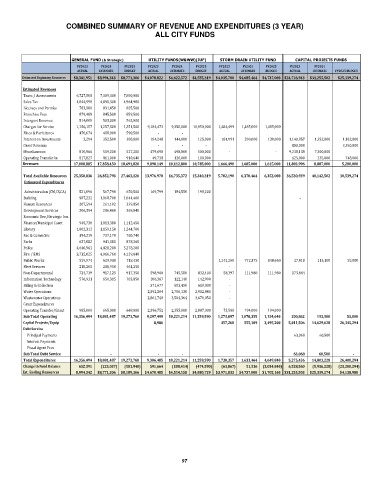
COMBINED SUMMARY OF REVENUE AND EXPENDITURES (3 YEAR)
                                                    ALL CITY FUNDS


                         GENERAL FUND (& Strategic)  UTILITY FUNDS(W&WW)(JUF)  STORM DRAIN UTILITY FUND  CAPITAL PROJECTS FUNDS
                           FY2023          FY2024      FY2025   FY2023          FY2024      FY2025   FY2023          FY2024      FY2025   FY2023          FY2024
                           ACTUAL  ESTIMATE  BUDGET  ACTUAL  ESTIMATE  BUDGET  ACTUAL  ESTIMATE  BUDGET  ACTUAL  ESTIMATE  FY2025 BUDGET
        Estimated Beginning Resources  $8,341,951  $8,994,343  $8,771,306  $4,078,822  $4,622,572  $4,555,319  $4,035,700  $4,685,464  $4,737,000 $24,726,943  $31,255,502  $25,339,274
         Estimated Revenues
          Taxes / Assessments         6,727,508        7,309,300       7,800,000
          Sales Tax            4,844,990        4,890,300       4,964,980
          Licenses and Permits            783,980           831,450          825,500
          Franchise Fees            879,489           845,500          859,500
          Intergovt Revenue            514,000           503,000          562,000
          Charges for Service         1,156,157        1,257,300       1,351,500        9,184,473        9,350,000     10,050,000       1,484,499       1,485,000       1,485,000
          Fines & Forfeitures            470,674           488,900          590,500                   -                   -
          Interest on Investments                3,294           352,500          300,000           184,248           144,000           125,000          181,991          200,000          130,000        1,140,857          1,352,000            1,102,000
          Grant Revenue                                           -                   -                   -           800,000            3,350,000
          Miscellaneous            810,966           519,200          527,200           479,690           498,800           500,000                   -                   -        9,238,139          7,300,000
          Operating Transfer In            817,827           861,000          910,640             49,738           120,000           110,000           625,000             235,000               748,000
          Total Current Year
         Revenues          17,008,885    17,858,450    18,691,820       9,898,149     10,112,800    10,785,000      1,666,490      1,685,000      1,615,000     11,803,996         8,887,000           5,200,000
                                          -                       -
          Total Available Resources     25,350,836    26,852,793    27,463,126     13,976,970     14,735,372    15,340,319      5,702,190      6,370,464      6,352,000     36,530,939      40,142,502         30,539,274
         Estimated Expenditures
           Administration (CM,CS,CA)            521,096           567,790          670,500           169,799           184,550           198,200
          Building                987,232        1,068,700       1,041,400                                       -
          Human Resources            207,594           261,102          339,850
          Development Services            206,394           286,460          369,040
          Economic Dev./Strategic Inn.
          Finance/Municipal Court            949,730        1,013,380       1,112,450
          Library              1,002,312        1,159,150       1,244,700
          Rec & Comm Svc            394,219           737,170          760,740
          Parks                   627,082           941,385          878,360
          Police               4,640,961        4,828,200       5,278,200
          Fire / EMS           3,735,025        4,066,760       4,129,640
          Public Works            559,974           629,930          718,430       1,141,200          772,375          848,660             27,418             113,100                  55,000
          Fleet Services            238,205           288,950          461,250                   -
          Non-Departmental            724,739           917,125          917,350           598,960           745,580           832,480             58,397          111,980          111,980           173,444
          Information Technology            576,931           650,385          703,850           106,367           122,140           142,990                   -
          Billing & Collection                            571,677           603,450           610,030                   -
          Water Operations                             2,592,204        2,706,130        2,912,840                   -
          Wastewater Operations                        2,861,740        3,504,364        3,676,050                   -
          Grant Expenditures
          Operating Transfer/Grant            985,000           665,000          648,000        2,396,752        2,355,000        2,887,000             73,500          194,000          194,000
          Sub Total Operating     16,356,494    18,081,487    19,273,760       9,297,499     10,221,214    11,259,590      1,273,097      1,078,355      1,154,640          200,862            113,100                 55,000
          Capital Projects/Equip                              8,986             457,260         555,109      3,495,200       5,011,506      14,629,628         26,345,294
          Debt Service
              Principal Payments                                                                          63,068               60,500
              Interest Payments
              Fiscal Agent Fees
          Sub Total Debt Service                    -                   -                   -             63,068              60,500                       -
          Total Expenditures     16,356,494    18,081,487    19,273,760       9,306,485     10,221,214    11,259,590      1,730,357      1,633,464      4,649,840       5,275,436      14,803,228         26,400,294
          Change in Fund Balance           652,391        (223,037)       (581,940)         591,664        (108,414)       (474,590)         (63,867)           51,536    (3,034,840)      6,528,560       (5,916,228)      (21,200,294)
         Est. Ending Resources       8,994,342  $8,771,306  $8,189,366  $4,670,485  $4,514,158  $4,080,729  $3,971,833  $4,737,000  $1,702,160 $31,255,503  $25,339,274  $4,138,980


                                                             97