
Page 46 - CityofWataugaAdoptedBudgetFY24
P. 46
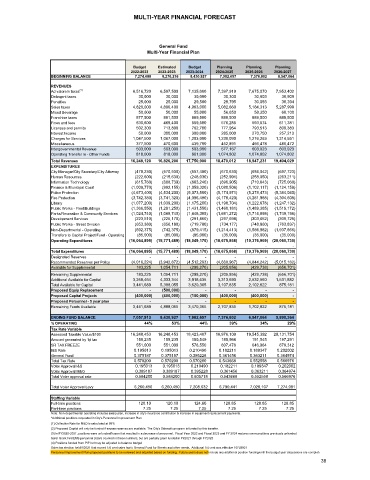
MULTI-YEAR FINANCIAL FORECAST


                                                      General Fund
                                                  Multi-Year Financial Plan

                                             Budget  Estimated  Budget   Planning  Planning  Planning
                                            2022-2023  2022-2023  2023-2024  2024-2025  2025-2026  2026-2027
                  BEGINNING BALANCE                 7,274,688         8,276,216         8,430,927         7,982,657            7,376,802          6,547,064
                  REVENUES
                  Ad valorem taxes (1)           6,516,720      6,597,500       7,135,000      7,397,919        7,675,070        7,953,402
                  Delinqent taxes                     30,000             30,000             30,000             30,300               30,603            30,909
                  Penalties                           25,000             25,000             29,500             29,795               30,093            30,394
                  Sales taxes                    4,820,000        4,890,400        4,983,000        5,082,660          5,184,313        5,287,999
                  Mixed Beverage                      50,000             50,000             55,000             56,650               58,350            60,100
                  Franchise taxes                   877,500           891,500           889,500           889,500             889,500           889,500
                  Fines and fees                    630,600           469,400           559,500           576,285             593,574           611,381
                  Licenses and permits              502,300           713,800           762,700           777,954             793,513           809,383
                  Interest Income                     50,000           300,000           300,000           285,000             270,750           257,213
                  Charges for Services           1,047,500        1,067,000        1,203,000        1,239,090          1,276,263        1,314,551
                  Miscellaneous                     377,500           470,600           439,700           452,891             466,478           480,472
                  Intergovernmental Revenue           503,000           503,000           503,000           577,167             603,923           603,923
                  Operating Transfer In - Other Funds           818,000           818,000           861,000        1,074,802          1,074,802        1,074,802
                  Total Revenues               16,248,120      16,826,200      17,750,900      18,470,012        18,947,231      19,404,029
                  EXPENDITURES
                  City Manager/City Secretary/City Attorney          (478,230)         (570,530)         (657,480)          (670,630)           (684,042)        (697,723)
                  Human Resources                  (222,600)         (215,630)         (248,030)          (252,991)           (258,050)        (263,211)
                  Information Technology           (615,760)         (608,739)         (683,240)          (696,905)           (710,843)        (725,060)
                  Finance & Municipal Court       (1,009,770)         (992,155)      (1,059,320)       (1,080,506)        (1,102,117)     (1,124,159)
                  Police Protection             (4,673,400)      (4,534,200)      (5,073,500)       (5,174,971)        (5,278,473)     (5,384,040)
                  Fire Protection               (3,742,380)      (3,741,320)      (4,096,490)       (4,178,420)        (4,261,988)     (4,304,608)
                  Library                       (1,077,200)      (1,039,200)      (1,175,200)       (1,198,704)        (1,222,678)     (1,247,132)
                  Public Works - Fleet/Buildings       (1,366,550)      (1,291,250)      (1,431,550)       (1,460,181)        (1,489,385)     (1,519,172)
                  Parks/Recreation & Community Services       (1,024,740)      (1,069,740)      (1,648,305)       (1,681,272)        (1,714,898)     (1,749,196)
                  Development Services             (223,510)         (225,170)         (291,860)          (297,698)           (303,652)        (309,725)
                  Public Works - Street Division          (653,380)         (656,180)         (719,780)          (734,177)           (748,860)        (763,837)
                  Non-Departmental - Operating          (892,375)         (742,375)         (879,415)       (1,214,413)        (1,566,982)     (1,937,866)
                  Transfers to Capital Project Fund - Operating           (85,000)           (85,000)           (85,000)            (35,000)             (35,000)          (35,000)
                  Operating Expenditures      (16,064,895)    (15,771,489)    (18,049,170)     (18,675,868)      (19,376,969)   (20,060,730)
                                                               -                      -                       -                      -                         -                      -
                  Total Expenditures          (16,064,895)    (15,771,489)    (18,049,170)     (18,675,868)      (19,376,969)   (20,060,730)
                  Designated Reserves                          -                      -                       -                      -                         -                      -
                  Recommended Reserves per Policy       (4,016,224)      (3,942,872)      (4,512,293)       (4,668,967)        (4,844,242)     (5,015,182)
                  Available for Supplemental           183,225        1,054,711          (298,270)          (205,856)           (429,738)        (656,701)
                  Remaining Supplemental            183,225        1,054,711          (298,270)          (205,856)           (429,738)        (656,701)
                  Additional Available for Capital        3,258,464        4,333,344        3,918,635        3,313,690          2,532,560        1,531,882
                  Total Available for Capital        3,441,689        5,388,055        3,620,365        3,107,835          2,102,822           875,181
                  Proposed Equip Replacement                      -          (500,000)                      -                      -                         -                      -
                  Proposed Capital Projects          (400,000)         (400,000)         (150,000)          (400,000)           (400,000)                     -
                  Proposed Personnel - 5 year plan                      -                      -                       -                      -                         -                      -
                  Remaining Funds Available        3,441,689        4,888,055        3,470,365        2,707,835          1,702,822           875,181
                  ENDING FUND BALANCE            7,057,913        8,430,927        7,982,657        7,376,802          6,547,064        5,890,364
                  % OPERATING                    44%      53%      44%       39%       34%      29%
                  Tax Rate Variable
                  Assessed Taxable Value/$100      16,248,453      16,248,453      18,423,407      18,976,109        19,545,392      20,131,754
                  Amount generated by 1¢ tax             159,235           159,235           180,549           185,966             191,545           197,291
                  SR TAX FREEZE               551,000  551,000  578,550   607,478   646,964  679,312
                  I&S Rate                   0.195013  0.195013  0.210490  0.182211  0.189347  0.202002
                  General Fund               0.375187  0.375187  0.395228  0.361456  0.363211  0.364974
                  Total Tax Rate             0.570200  0.570200  0.570200  0.543668  0.552558  0.566976
                  Voter Approval I&S          0.195013  0.195013  0.210490  0.182211  0.189347  0.202002
                  Voter Approval M&O          0.389187  0.389187  0.395228  0.361456  0.363211  0.364974
                  Total Voter approval rate   0.584200  0.584200  0.605718  0.543668  0.552558  0.566976
                  Total Voter Approval Levy  6,260,450  6,260,450  7,208,632  6,790,441  7,028,107  7,274,091

                  Staffing Variable
                  Full-time positions          120.10   120.10   124.60    128.85    128.85   128.85
                  Part-time positions           7.25     7.25      7.25     7.25       7.25     7.25
                  Note: Non-departmental operating includes salary plan, Increase in city's insurance contribution & increase in equipment replacement payments.
                  *Additional positions requested in City's Personnel Improvement Plan
                  (1) Collection Rate for M&O is calculated at 99%
                  (2) Proposed Capital will only be funded if excess reserves are available. The City's Sidewalk program is funded by this transfer.
                  (3) In FY2020-2021, positions were unfunded/frozen that resulted in a decrease of personnel.  Fiscal Year 2022 and Fiscal 2023 and FY 2024 restores some positions previously unfunded.
                  Safer Grant Fire/EMS personnel (6)are counted in these numbers, but are partially grant funded in FY2021 through FY2023
                  (4) Positions funded from PIP but may be adjusted to balance budget
                  Sales tax election held 5/2021 that moved 1/4 cent sales tax to General Fund for Streets and other needs.  Additonal 1/4 cent was effective 10/1/2021
                  Personnel Improvement Plan proposed positions to be reviewed and adjusted based on funding.  Future years does not include any additional position funding until the budget year discussions are complete
                                                                                                           38