
Page 104 - CityofWataugaAdoptedBudgetFY24
P. 104
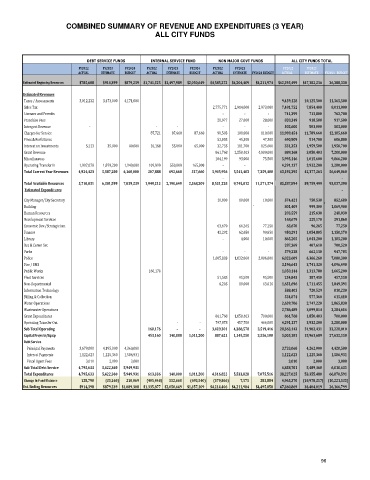
COMBINED SUMMARY OF REVENUE AND EXPENDITURES (3 YEAR)
ALL CITY FUNDS
DEBT SERVICE FUNDS INTERNAL SERVICE FUND NON MAJOR GOVT FUNDS ALL CITY FUNDS TOTAL
FY2022 FY2023 FY2024 FY2022 FY2023 FY2024 FY2022 FY2023 FY2022 FY2023
ACTUAL ESTIMATE BUDGET ACTUAL ESTIMATE BUDGET ACTUAL ESTIMATE FY2024 BUDGET ACTUAL ESTIMATE FY2024 BUDGET
Estimated Beginning Resources $785,608 $914,399 $879,239 $1,741,325 $1,497,989 $2,050,649 $4,585,272 $4,204,409 $4,211,974 $42,395,499 $47,382,236 36,388,330
Estimated Revenues
Taxes / Assessments 3,012,232 3,473,000 4,171,000 9,459,128 10,125,500 11,365,500
Sales Tax 2,775,771 2,914,000 2,973,000 7,481,752 7,854,400 8,011,000
Licenses and Permits - - - 741,399 713,800 762,700
Franchise Fees 28,977 27,000 28,000 820,349 918,500 917,500
Intergovt Revenue - - - - - - 502,600 503,000 503,000
Charges for Service 87,721 87,660 87,660 90,503 100,000 110,000 11,989,454 11,789,660 12,185,660
Fines & Forfeitures 52,003 45,300 47,300 690,909 514,700 606,800
Interest on Investments 5,113 35,000 40,000 10,168 55,000 65,000 32,735 111,700 125,600 331,353 1,959,500 1,950,700
Grant Revenue 861,768 2,250,403 4,000,000 889,168 3,050,403 7,200,000
Miscellaneous 104,199 93,000 75,500 5,995,146 1,015,600 9,866,200
Operating Transfer In 1,907,078 1,879,200 1,949,000 109,999 550,000 165,000 - - 4,291,137 3,932,200 3,280,000
Total Current Year Revenues 4,924,423 5,387,200 6,160,000 207,888 692,660 317,660 3,945,956 5,541,403 7,359,400 43,192,395 42,377,263 56,649,060
- -
Total Available Resources 5,710,031 6,301,599 7,039,239 1,949,213 2,190,649 2,368,309 8,531,228 9,745,812 11,571,374 85,587,894 89,759,499 93,037,390
Estimated Expenditures -
City Manager/City Secretary 10,000 10,000 10,000 574,421 750,530 852,680
Building ` 801,409 999,300 1,069,900
Human Resources 203,559 215,630 248,030
Development Services 168,679 225,170 291,860
Economic Dev./Strategic Inn. 63,670 66,265 77,250 63,670 96,265 77,250
Finance 42,292 62,650 90,850 950,291 1,054,805 1,150,170
Library - 4,000 10,000 865,205 1,043,200 1,185,200
Rec & Comm Svc 287,369 407,610 700,520
Parks - - - 579,228 662,130 947,785
Police 1,605,803 1,832,060 2,006,800 6,023,609 6,366,260 7,080,300
Fire / EMS 3,196,643 3,741,320 4,096,490
Public Works 160,176 1,050,144 1,313,780 1,665,200
Fleet Services 51,585 95,500 95,500 254,843 387,450 457,150
Non-Departmental 6,205 10,000 63,016 1,651,696 1,711,455 1,849,391
Information Technology 588,403 720,529 810,230
Billing & Collection 534,874 577,360 615,410
Water Operations 2,639,706 2,747,220 2,865,830
Wastewater Operations 2,786,489 3,099,814 3,284,614
Grant Expenditures 861,768 1,850,403 700,000 861,768 1,850,403 700,000
Operating Transfer Out - - 797,878 457,700 466,000 4,291,137 3,932,200 3,280,000
Sub Total Operating 160,176 - - 3,429,201 4,388,578 3,519,416 28,363,143 31,902,431 33,228,010
Capital Projects/Equip 453,160 140,000 1,011,200 887,621 1,145,250 3,556,100 5,005,181 15,963,689 27,632,150
Debt Service
Principal Payments 3,670,000 4,195,000 4,360,000 3,733,068 4,262,000 4,420,500
Interest Payments 1,122,623 1,225,360 1,586,931 1,122,623 1,225,360 1,586,931
Fiscal Agent Fees 3,010 2,000 3,000 3,010 2,000 3,000
Sub Total Debt Service 4,795,633 5,422,360 5,949,931 4,858,701 5,489,360 6,010,431
Total Expenditures 4,795,633 5,422,360 5,949,931 613,336 140,000 1,011,200 4,316,822 5,533,828 7,075,516 38,227,025 53,355,480 66,870,591
Change in Fund Balance 128,790 (35,160) 210,069 (405,448) 552,660 (693,540) (370,866) 7,575 283,884 4,965,370 (10,978,217) (10,221,531)
Est. Ending Resources $914,398 $879,239 $1,089,308 $1,335,877 $2,050,649 $1,357,109 $4,214,406 $4,211,984 $4,495,858 47,360,869 36,404,019 26,166,799
96